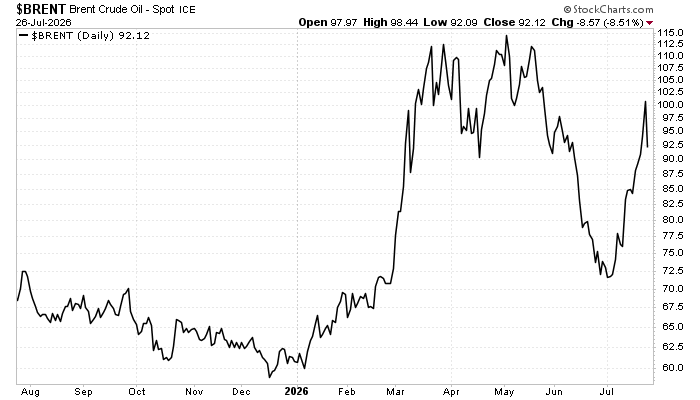
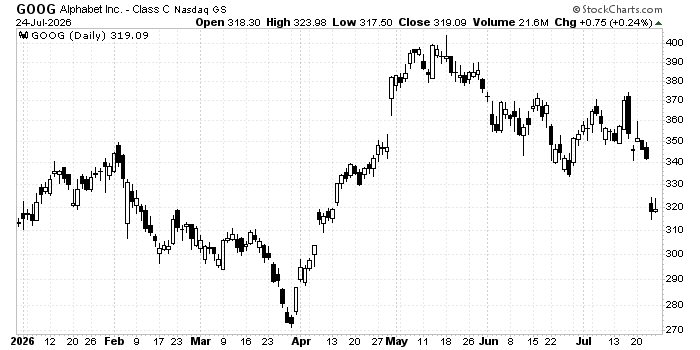
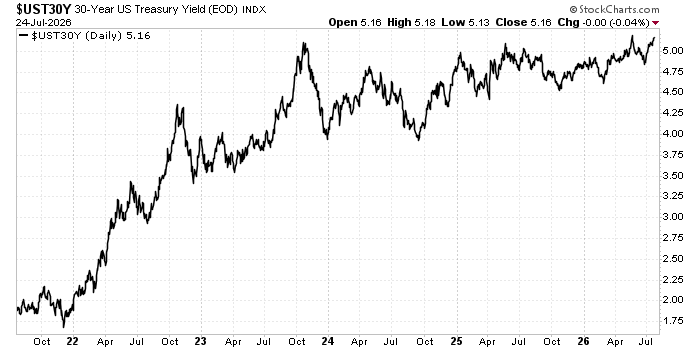
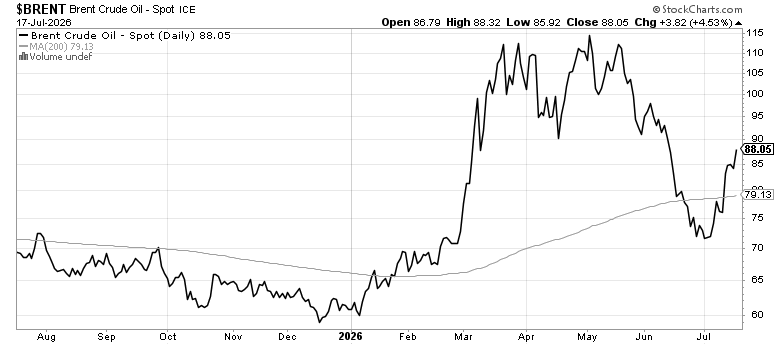
Markets sent mixed signals this week rather than moving as one. US shares lagged, led down by big technology names, while government bond yields stayed high and gold and the US dollar both firmed — a combination that doesn’t fit neatly into either a “risk-on” or “risk-off” box. Oil prices, which had rallied hard through the month on Middle East tensions, reversed sharply in the final days of the week.
TOP THEMES THIS WEEK
1. The cost of the AI build-out is starting to worry investors. Alphabet (Google’s parent company) raised its planned 2026 spending on AI infrastructure to between $195 billion and $205 billion, and investors reacted badly, seeing $200 billion as a level the company shouldn’t cross. This matters because it signals a shift in mood: investors are no longer giving technology companies a free pass on spending and want to see this money turning into actual profit, not just rising costs.
2. Government bond yields remain uncomfortably high, and “bond vigilantes” are back in the conversation. The US 30-year government bond yield has stayed above 5% for its longest run since 2007, and annual US interest payments have now passed $1 trillion a year. This matters because higher long-term borrowing costs make it more expensive for governments and companies to borrow, and can act as a drag on share prices by giving investors an attractive, safer alternative to equities.
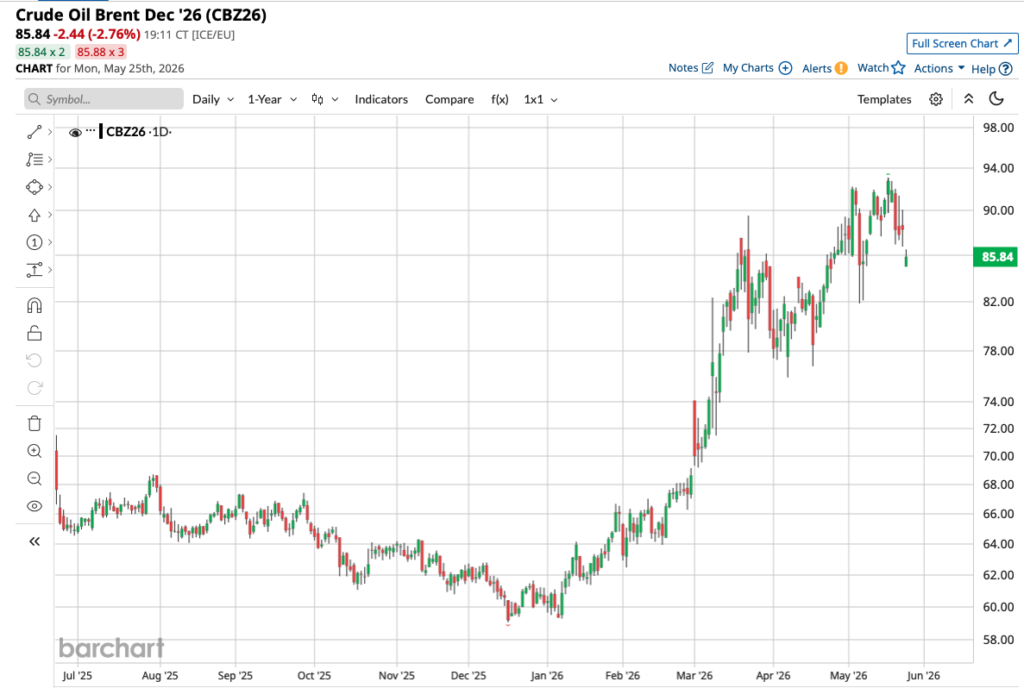
3. The US-Iran conflict pushed oil and bond yields higher through the week — but oil turned sharply by Friday.Renewed fighting between the US and Iran drove a rebound in oil prices and further selling of US government bonds earlier in the week, but Brent crude fell 4.7% and petrol prices fell 3.3% by week’s end, unwinding a chunk of the month’s gains. This matters because oil is the clearest read on how seriously markets are pricing the conflict — a genuine cooling in prices would suggest markets see the risk easing, but this could just as easily reverse if the situation flares up again.
4. Private credit funds are quietly tightening access to investor cash. A number of private credit funds have been forced to cap withdrawals after a surge in redemption requests, and many are dropping the “easy access” language they used to market these funds. This matters because it’s a reminder that private credit, often sold to clients as flexible and low-risk, can become harder to exit precisely when investors most want their money back.
WATCH THIS NEXT WEEK
Oil prices. Given how much of this month’s move was tied to the Iran conflict, the sharp reversal in Brent and petrol prices on Friday is the single most useful signal heading into next week. If the reversal holds, it suggests markets are starting to price in some de-escalation. If it snaps back higher, it confirms the conflict is still the dominant driver of markets, and inflation and interest rate expectations will likely follow oil higher with it.
INVESTMENT IMPLICATIONS
This week’s news reinforces that two separate pressures are building on markets at once: elevated government bond yields that make borrowing more expensive and give investors a real alternative to shares, and a technology sector facing tougher questions about whether its enormous AI spending is paying off. Neither of these resolved this week, and both are worth watching closely rather than treating as background noise. On the geopolitical side, oil remains the cleanest gauge of how seriously the market is taking the Iran conflict, and its next move will say more than any headline will.
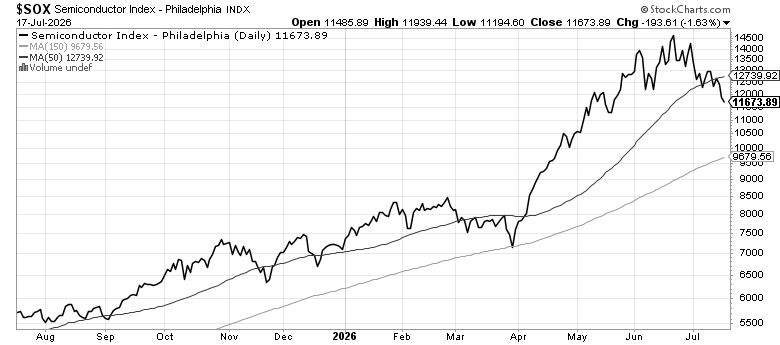
This was a week where one story dominated: the AI trade came off the boil, hard. Semiconductor and South Korean equities fell sharply while the broader market barely moved, oil and gas jumped on renewed Middle East conflict, and gold kept sliding despite the turmoil elsewhere. The mood is best described as rational caution rather than clearly risk-on or risk-off. Investors were clearly nervous about AI valuations, but that nervousness didn’t spread into concerns about a bear market.
TOP THEMES THIS WEEK
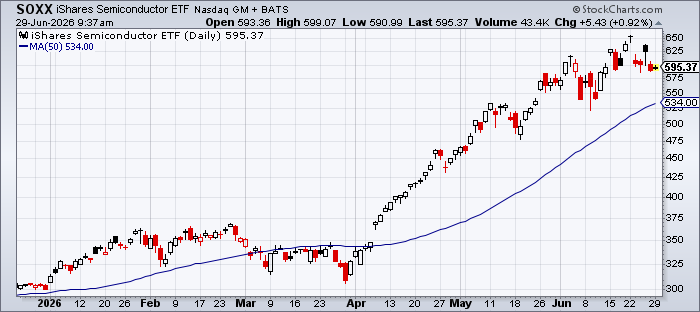
1. The AI trade cracked, but only in semiconductor names. Semiconductors fell over 10% this week and nearly 19% this month, and South Korea’s market suffered its steepest single-day fall of the year on 13 July. The Kospi closed down 8.95%, having been down as much as 9.26% intraday after brokers questioned SK Hynix earnings outlook revived fears that AI memory chip demand is slowing. The rout was worsened by single-stock leveraged funds tracking Samsung and SK Hynix, which were forced to sell mechanically as the shares fell, deepening the decline. This matters because it shows how concentrated recent market gains have been: when the AI story wobbles, it’s a small group of stocks doing almost all the damage, while the rest of the market holds up — and it shows how leveraged products can turn an ordinary correction into something much more violent.
2. Chinese AI firms are closing the gap on US labs, and doing it far more cheaply. Chinese developers Moonshot and DeepSeek released models that reportedly match or beat leading US models, with DeepSeek said to cost a fraction of what US competitors charge for similar tasks. This matters because it undermines the idea that today’s leading AI companies have a lasting edge. If AI capability becomes widely available and cheap, the companies that make the most money may be the ones with other advantages, such as owning the hardware people already use or the power needed to run these systems, rather than the AI software itself.
3. China’s economy is slowing by more than officials wanted. Second-quarter growth came in at 4.3%, below the government’s own target range of 4.5% to 5%, and the weakest reading since late 2022. Property investment fell 18% in the first half of the year as part of a broader 5.7% decline in fixed-asset investment. On a positive note, industrial production accelerated to a three-month high of 5.3% in June, while retail sales unexpectedly rebounded to 1%. Onshore Chinese equities were broadly flat-to-slightly lower, while Hong Kong-listed shares outperformed. This signalled investors are not surprised and markets are looking beyond the slowdown.
4. The Middle East conflict escalated again, and oil, gas and petrol prices jumped hard. The US struck Iranian missile sites after an interim peace deal broke down, reviving fears that Iran could disrupt shipping through the Strait of Hormuz, a route that carries around a fifth of the world’s oil and gas. This matters because it directly threatens global energy supply, and the price moves this week — oil, gas and petrol all up double digits over the week — suggest markets are taking the threat seriously, not dismissing it as noise.
WATCH THIS NEXT WEEK
Semiconductors, and South Korea as a proxy for it. This is the single area that will tell us whether this week was a healthy pullback in an extraordinary run — semiconductors are still up 73% this year and nearly 200% over three years — or the start of a genuine unwind in AI-linked leadership. If the selling continues, it confirms this week wasn’t a one-off; if it stabilises, this looks more like a shakeout of overcrowded, leveraged positioning rather than a real change in the AI story.
INVESTMENT IMPLICATIONS
This week reinforces the case for diversification within equities rather than a wholesale shift out of them — the damage was heavily concentrated in AI and semiconductor names, while value and smaller companies were largely untouched. On energy, the sharp rise in oil and gas prices tied to the Middle East conflict is a reminder that this remains a live risk worth holding some protection against, whether through energy exposure. Investors should also be alert to how much of recent index gains have depended on a small number of AI-related stocks, since that concentration is exactly what made this week’s reversal look so much larger than the headline market indices suggest.
Banks just reported some of their best profits in history. On the surface, that looks like a strong vote of confidence in the economy and markets. But when one looks closer, the strength is coming from one part of banking — trading and dealmaking — while the more traditional, everyday lending business is turning more cautious. Meanwhile, a separate corner of the credit world (private lending funds) is showing real strain.
So the honest answer is: yes, financials are confirming the bull market, but only part of the sector is doing the confirming, and the part that isn’t is worth watching.
What’s genuinely new: bond yields have jumped because the ceasefire with Iran broke down again on 8 July, pushing oil prices and inflation worries higher. That’s a near-term (under three months) development.
What’s improved: bank profits, driven by trading desks and deal-making. That’s a shorter-term (three to twelve months) trend tied to market volatility, not necessarily something that lasts for years.
What’s deteriorated: private lending funds are under real pressure, with funds restricting investor withdrawals and regulators paying closer attention. That looks like a longer-running (six months to two years) problem, not a passing scare.
What hasn’t changed: everyday credit markets remain calm. Companies can still borrow cheaply, and the Federal Reserve has kept interest rates steady since June, with markets expecting another pause at the end of July.
1. What Bond Yields Are Telling Us
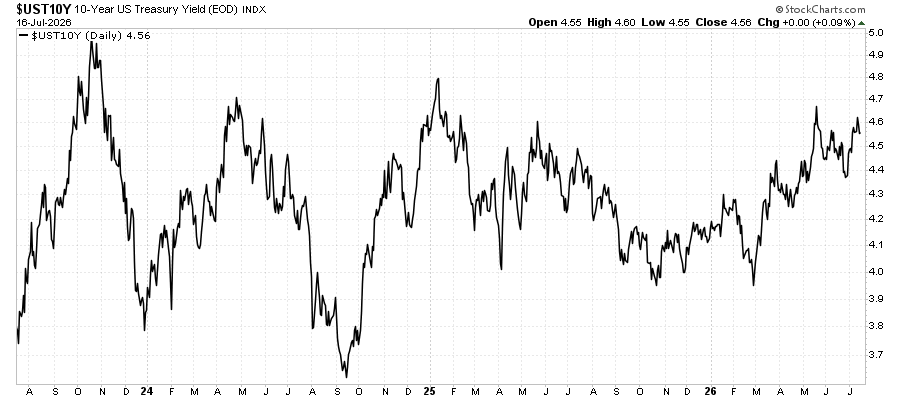
The facts: The 2-year US government bond now yields 4.2%, and the 10-year yields 4.6%. Longer-term yields sit above shorter-term ones, which is the normal, healthy shape for the yield curve. Both yields have risen together since fighting with Iran flared up again on 8 July. The Fed has kept its main interest rate at 3.50–3.75% since June, and futures markets currently expect it to hold rates steady again at its 29 July meeting.
What it means: Short and long-term yields are rising together. This matters because there are two very different reasons yields can climb: either the economy is expected to grow more strongly, or investors are worried about inflation and demanding more compensation for lending money over the long term. Right now, this looks like the second case — an inflation and oil-price story following the renewed conflict, rather than the market suddenly expecting the Fed to cut rates aggressively because of a weakening economy. In fact, futures markets show almost no expectation of near-term rate cuts, which tells us investors are not pricing in a recession.
Why this matters for banks: A more normal-shaped yield curve, where long-term rates sit comfortably above short-term rates, is generally good for bank profitability, because banks borrow short-term (like savings deposits) and lend long-term (like mortgages), earning the difference. Bond markets and share markets currently agree with each other — neither is signalling an imminent downturn.
What could go wrong: If the Iran conflict escalates further and oil prices stay above roughly $80 a barrel, this could turn into a more troubling combination of higher inflation and slower growth. That would be a genuinely negative environment for banks, forcing the Fed to keep rates higher for longer even as the economy weakens.
2. Is Credit Flowing Freely or Drying Up?
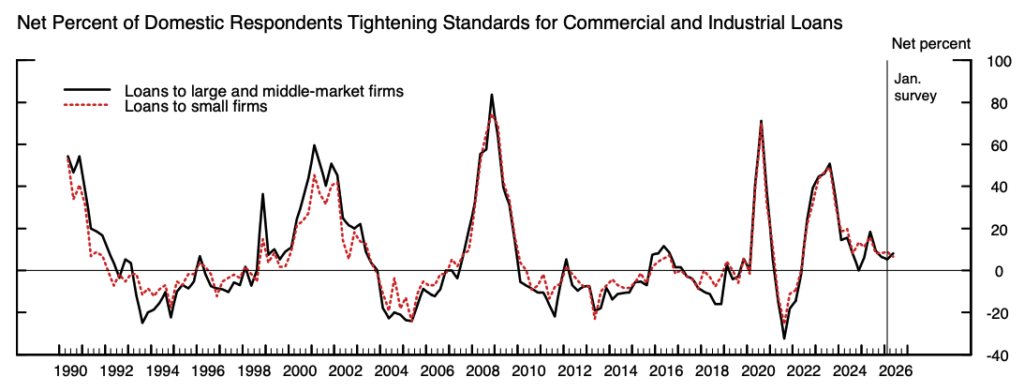
The facts: The Federal Reserve’s latest survey of senior bank loan officers (covering the first quarter of 2026) found that banks are, on balance, tightening their standards for business loans, while demand from borrowers has stayed roughly flat. Banks also said they’ve tightened lending standards over the past year specifically for loans to private lending funds. Separately, a broad measure of financial conditions from the Chicago Fed shows conditions are looser than average overall.
What it means: This is a genuine split. On one hand, banks are becoming more careful about who they lend to directly, especially when lending to other lenders in the private credit space. On the other hand, overall financial conditions remain easy, because companies can still raise money cheaply through the stock and bond markets. In other words, credit is not so much expanding through traditional bank loans right now — it’s flowing more through capital markets and non-bank lenders instead.
Our assessment: Lending standards are tightening at the margin, but conditions overall are not restrictive. This looks like normal late-stage caution from banks, not the start of a credit crunch.
3. Are Credit Markets Still Backing the Rally?
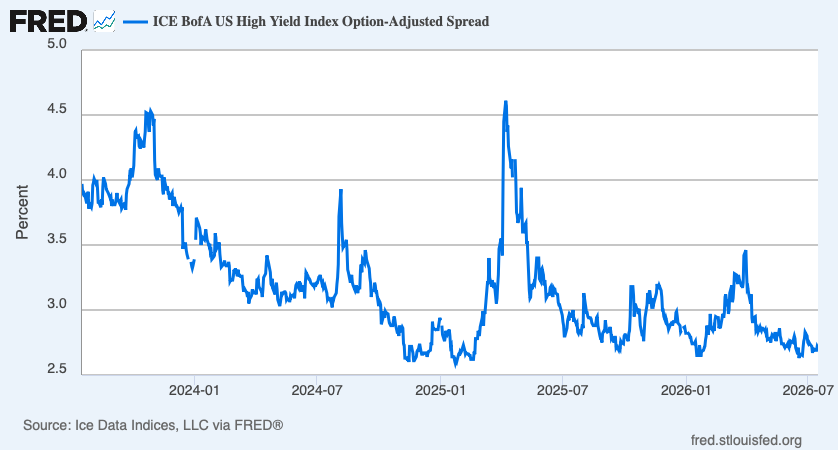
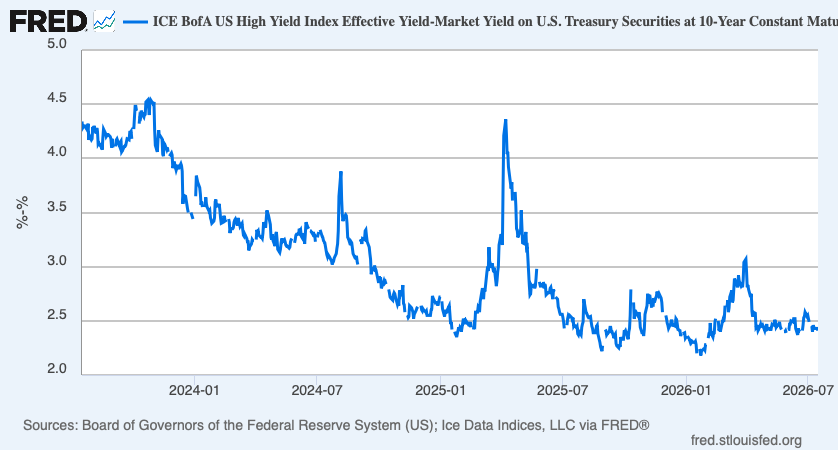
The facts: The extra interest rate that investors demand to lend to riskier, “high-yield” companies (compared with safe government debt) is sitting near its lowest level in years — around 2.4 percentage points.
What it means: When investors demand very little extra compensation to lend to riskier companies, it usually means they see very little risk of default. That’s a vote of confidence, and it’s currently backing up the optimism we’re seeing in share prices. But there’s a catch: spreads this tight leave very little room to move in a positive direction. If sentiment turns, there’s much more room for these gaps to widen (get worse) than to narrow further (get better). So this part of the market is giving investors no early warning of trouble ahead.
The catch to flag: While these public, tradeable credit markets look calm, the private lending market — a roughly $2 trillion industry that is increasingly connected to banks and insurers — is not calm at all (more on this below). So the “all clear” signal from public credit markets may be masking a problem building in a less visible corner of the credit world.
4. How Healthy Is the Financial Sector, Really?
The facts: JPMorgan reported record profits of $21.2 billion for the second quarter — the highest quarterly profit in US banking history — driven by trading activity (up 86% year-on-year in equities) and investment banking fees (up 30%). All five of the largest US banks beat analysts’ expectations this earnings season. Smaller, regional banks have also been outperforming the broader financial sector for much of the year, which is encouraging, because regional banks rely on traditional, everyday lending rather than trading, so their strength is a purer read on the health of the real economy.
What it means: The strongest part of the financial sector right now is the trading and dealmaking side of banking — benefiting from record levels of mergers and acquisitions and heightened market volatility caused partly by the Iran conflict. This is a shorter-term, volatility-driven boost to profits, not necessarily a sign of a structurally stronger banking business built on steady loan growth. Insurance companies, by contrast, have lagged the broader market, partly due to growing concerns about their exposure to private lending funds.
Our assessment: It’s encouraging that both large trading-focused banks and smaller regional lenders are doing well at the same time — that’s a broader, healthier signal than if only one type of bank were leading. But we should be clear-eyed that much of the current profit boost comes from a source (trading revenue) that tends to rise and fall quickly with market conditions, rather than steady, repeatable loan income.
5. Is This Strength Spreading, or Narrowing?
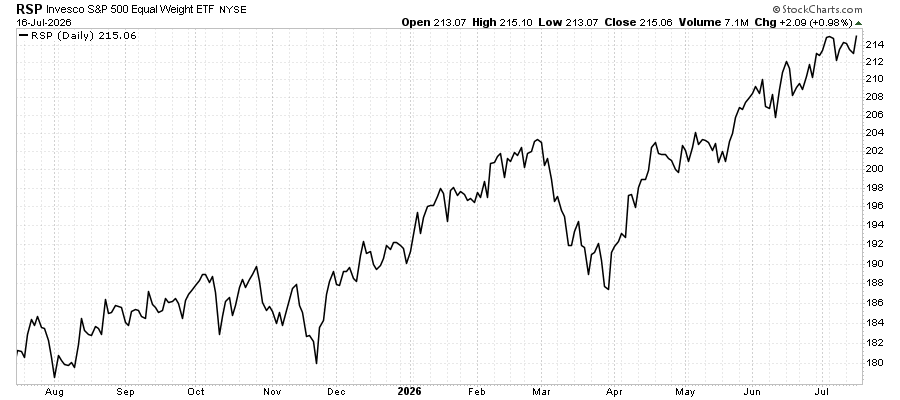
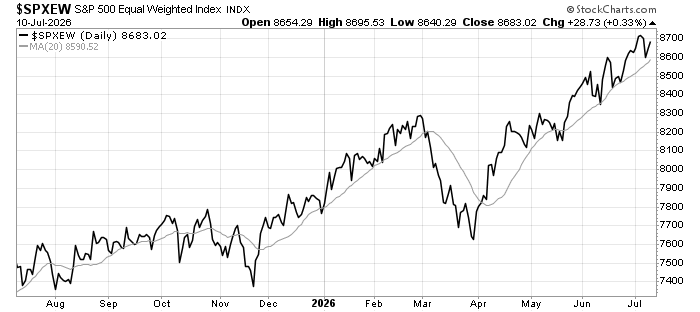
The facts: Smaller US companies (measured by the Russell 2000 index) have returned about 21% so far this year, comfortably ahead of the roughly 10.5% return from the large-company S&P 500 index. A version of the S&P 500 that gives every company equal weight, rather than favouring the very largest firms, has returned about 13%. Even so, the ten largest companies in the S&P 500 still make up around 37–38% of the entire index.
What it means: This is good news. For much of the past couple of years, market gains have been concentrated in a small handful of giant technology companies. Now we’re seeing smaller companies and the “average” stock doing better than the market’s biggest names. That’s the opposite of the narrow, fragile-looking leadership that has often preceded trouble in the past. The strength we’re seeing in financials is being echoed elsewhere in the market, not happening in isolation.
Our assessment: Market participation is broadening, not narrowing. This is a supportive sign, not a warning sign, for how sustainable the current rally is.
6. The Five Biggest Risks to Watch
Risk
How likely
When it could hit
How big the impact could be
What to watch for early
Iran conflict flares up further, oil prices spike
Elevated right now
Next 0–3 months
High — pushes inflation and bond yields higher, keeps the Fed cautious for longer
Oil sustained above $85–90 a barrel; shipping through the Strait of Hormuz slowing
Stress in private lending funds spreads to banks and insurers
Moderate
Next 6–18 months
Medium to high — could hit bank and insurer balance sheets directly
More private funds restricting investor withdrawals; insurers writing down private loan values
Calm credit markets suddenly turn nervous
Moderate
Next 3–12 months
Medium — a broad repricing of risk across corporate debt
The extra yield demanded on risky company debt rising sharply from today’s low levels
Slowdown in AI-related business investment feeds through to markets
Moderate
Next 3–12 months
Medium — this is currently a key driver of the trading and dealmaking profits banks are enjoying
Big technology companies signalling they’ll spend less on AI infrastructure
Inflation stays stubbornly high, forcing the Fed to stay tighter for longer even as growth slows
Moderate
Next 6–12 months
High — squeezes bank lending margins and pressures the wider economy
Inflation readings reaccelerating; bond markets pricing in higher long-term inflation even as growth data weakens
Bottom Line
Is the financial sector still confirming the bull market? Yes, but only part of it. The trading and dealmaking side of large banks, along with regional banks, is confirming strongly. Traditional lending and the private credit corner of the sector are not.
Is this healthy growth, or a warning sign of excess this late in the cycle? A bit of both. Record bank profits and broader participation from smaller companies look genuinely healthy. But credit spreads sitting near record lows, banks quietly tightening lending standards even as profits soar, and real stress building in private lending funds are all classic signs of a market that’s further along in its cycle than the headlines suggest.
What’s the strongest evidence supporting a positive view? Market gains are broadening out to smaller companies and the average stock, rather than being concentrated in a handful of giants. Historically, that kind of broadening has been a healthier, more reassuring signal than narrow leadership.
What’s the strongest evidence against it? The gap between glowing trading profits and quietly tightening bank lending standards, combined with a private lending market genuinely under stress for the first time since it grew large, suggests the sector’s headline strength is concentrated in the part of the business most exposed to a sudden swing in market mood, not the part that reflects steady, everyday demand for credit in the economy.
What would change our view? Three things would move us from “cautiously positive” to genuinely worried: a sharp and sustained rise in the extra yield demanded on risky corporate debt; another quarterly bank survey showing broad, deepening reluctance to lend alongside weakening demand; or clear evidence that stress in private lending funds is spreading onto the balance sheets of mainstream banks.
Markets turned defensive this week. US large-cap tech held up and kept the S&P 500 in positive territory, but that strength masked a broad retreat elsewhere. Small caps, value stocks, Europe, emerging markets, and government bonds all fell as the dollar and oil prices rose together. This looks more like markets pricing in renewed inflation risk, which is why bonds sold off and equities narrowed at the same time.
TOP THEMES THIS WEEK
The AI trade is losing its momentum. Samsung’s enormous profit jump still triggered an 8% share price fall, and Amazon had to offer higher premiums to get its AI-infrastructure bonds away. Both are signs that investors are raising the bar for returns on equity. This matters because if debt and equity markets both start pricing AI infrastructure more cautiously, the “easy” phase of the AI rally is over.
Oil staged a sharp reversal contrast with the glut narrative during the week. Oil prices started the week at $72 on news that Saudi Aramco was cutting prices for Asian buyers. Yet as the week progressed, Brent was up almost 10% on a breakdown of the ceasefire between Iran and the US, and sporadic attacks on ships traversing the Straits of Hormuz.
Private credit is showing real liquidity strain. Over $14.5 billion of investor capital is currently stuck in funds — including ones run by Blackstone and Apollo — that have hit their withdrawal caps, and HSBC has reportedly started pulling back from lending to riskier funds after a run of bankruptcies exposed weak underwriting. This matters because private credit has been sold to many investors as a steady, bond-like alternative. A liquidity squeeze here is a reminder that “steady” doesn’t mean “liquid,” and redemption gates can trap capital exactly when investors want it back. Nonetheless, markets are still on show a contagion to the broader financial system.
Market breadth has narrowed. This week’s equity gains were carried almost entirely by large-cap growth and tech, while small caps, value, and most of the rest of the world fell. This bears watching as a failure to recover will challenge the rotation thesis that we have seen thus far. The trend is not broken yet.
INVESTMENT IMPLICATIONS The inflation signal coming from oil, bonds, and the dollar moving together is a result of the failed Iran-US ceasefire. We remind readers to note the need for both parties to resume shipment of oil in the Strait, and also how the Middle East producers are finding ways to ship oil without relying on the Strait. Nonetheless, how high oil prices go in the short term and how long it stays there can push inflationary pressure higher for longer. There will be implications for central banks and risk assets.
MARKETS IN BRIEF Markets sent a mixed signal this week. The broad market held up well. Europe, Japan, value stocks and the S&P 500 all posted gains but the crowded AI and Asia tech trade cracked, with semiconductors and South Korea both down sharply after a huge year-to-date run. Gold rose alongside a sell-off in long-dated bonds, which could point to inflation worries rather than a clean flight to safety. Overall mood: a narrow correction inside a broad market, not a broad risk-off move.
TOP THEMES THIS WEEK
AI trade shows signs of strain. Meta is building a new cloud business to sell access to its AI computing power, while companies more broadly are tightening cost control on AI spending as they shift from simple chatbots to more expensive autonomous agents. This matters because it suggests the market is moving from an AI hype phase into an AI cost-and-return scrutiny phase. BlackRock has already downgraded emerging-market equities to neutral on concerns that AI-linked stocks in Taiwan and South Korea have become too concentrated a bet.
Private credit redemptions hit a record. Investors asked to withdraw $15.6 billion from private credit funds in the second quarter, but managers only returned $5.9 billion, forcing firms like Blue Owl to cap withdrawals again. This matters for advisers because it’s a live reminder that “semi-liquid” private credit funds are not as easy to exit as public markets suggest, and clients holding these should expect withdrawals to stay rationed for some time.
Oil is swinging from scarcity to surplus. Shipping costs through the Strait of Hormuz have halved since the US-Iran ceasefire, and both Goldman Sachs and Morgan Stanley now expect a global oil surplus of 2–3 million barrels a day next year. This matters because it takes pressure off inflation from the energy side, but it’s a headwind for energy sector earnings and a sign that the geopolitical risk premium built into oil prices this year is unwinding. This squares with the sharp monthly fall we’re seeing in Brent.
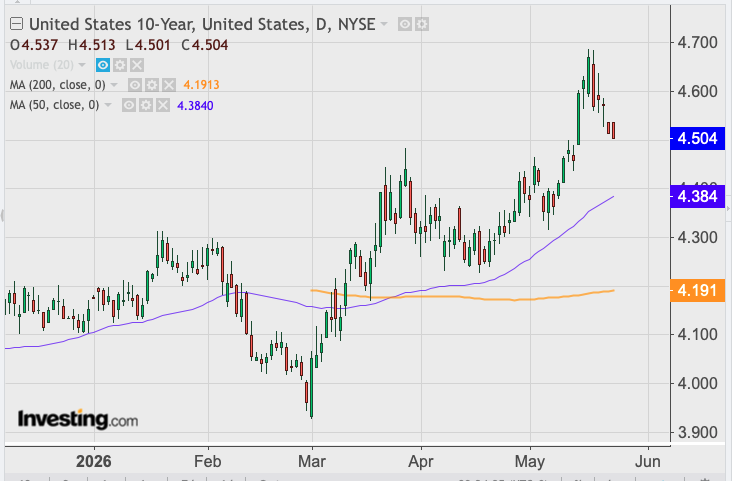
A new, more hawkish Fed and yen weakness. New Fed Chair Kevin Warsh has signalled an inflation-first stance, and markets are now pricing in rate hikes rather than cuts for late 2026. At the same time the yen has hit a 40-year low, with some traders treating a slide to 200 against the dollar as a real possibility if the Bank of Japan stays behind the curve. This matters because it’s consistent with what we saw in the price data. Long bond yields rising sharply this week even though the one-month trend was flat, which tells us rate expectations moved fast in the last few days.
INVESTMENT IMPLICATIONS This week’s move looks like a rotation out of the most crowded, most expensive trade of the year rather than a broad flight from risk. The wider equity market and credit markets aren’t confirming panic. That said, the combination of record margin debt, a more hawkish Fed, and heavy concentration in AI-linked names means any further wobble in semiconductors or Korea could turn from a rotation into something sharper. Investors overweight AI and North Asia tech deserve a conversation about concentration risk now, while private credit holdings need a reminder that liquidity there is constrained for the foreseeable future.
Markets remained broadly constructive, although leadership narrowed noticeably this week. Profit-taking was concentrated in semiconductors and Asian equities after exceptionally strong gains, while US equities, credit markets and bonds remained resilient, suggesting rotation rather than a broader shift towards risk aversion.
1. Private credit liquidity is becoming a bigger concern
Several large private credit funds, including those managed by Ares Management and Morgan Stanley, capped investor redemptions after facing unusually high withdrawal requests. While listed credit markets remain stable, these events highlight growing liquidity risks in private markets and reinforce the need to distinguish between valuation risk and liquidity risk.
2. AI enthusiasm is facing its first meaningful test
The sharp correction in semiconductor shares and highly leveraged AI-related markets, particularly in Taiwan, reflects investors taking profits after an extraordinary rally. At the same time, AI adoption continues to broaden across governments and businesses, suggesting the investment story is shifting from speculation towards practical implementation rather than ending altogether.
3. Geopolitical risk premium continues to fade
Oil prices fell further as concerns over disruption to Middle East energy supplies eased despite continued uncertainty surrounding the Strait of Hormuz. The market is increasingly pricing a lower probability of a prolonged energy shock, reducing near-term inflation risks and supporting the broader macro outlook.
4. Fed expectations remain the anchor for markets
Major investment banks lowered their gold price forecasts as resilient US economic data reduced expectations of imminent Federal Reserve rate cuts. This reinforces the view that monetary policy, rather than geopolitical headlines, continues to be the dominant driver of cross-asset performance.
The semiconductor sector remains the key market to monitor. This week’s sharp correction represents the first significant test of investor conviction in the AI-led rally. If semiconductor shares stabilise while credit markets remain healthy, the recent weakness is likely to prove a normal consolidation. However, further weakness accompanied by deteriorating credit conditions would suggest that market leadership is beginning to break down.
This week’s news flow and market action continue to support a constructive, but more selective, investment stance. The absence of widening credit spreads, US dollar strength or broad-based equity weakness suggests the bull market remains intact despite increased volatility in AI-related assets. However, developments in private credit and the concentration of market leadership warrant closer monitoring, as liquidity stress and further weakness in semiconductor stocks could become the first signs of a broader deterioration in market conditions.
It was a broad selloff. Almost every asset class fell together. Equities, bonds, and gold saw losses, with the US dollar and defensive value stocks holding their ground.
TOP THEMES THIS WEEK
1. The “higher for longer” trade is back and market are repricing fast Strong US jobs data (172,000 added in May) and the fastest expansion in manufacturing in four years have forced a rethink on where interest rates are headed. Market observers are still divided: JPMorgan and BNP Paribas now expect a rate hike as early as December 2026, while Goldman Sachs and Citigroup still expect cuts. Bond market’s broad weekly selloff suggests traders are siding with the hawks.
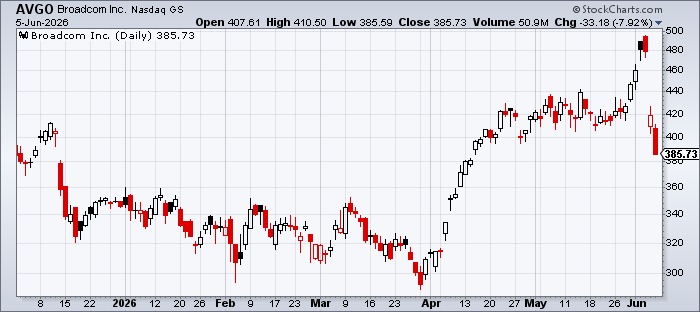
2. The AI trade hit a reality check Broadcom’s shares fell sharply after its AI chip revenue outlook, while strong in absolute terms, fell short of the extreme growth investors had already priced in. What matters: this is the clearest signal yet that the AI trade is no longer being rewarded for being good. It now has to be extraordinary, and the gap between investor expectations and corporate delivery is narrowing dangerously.
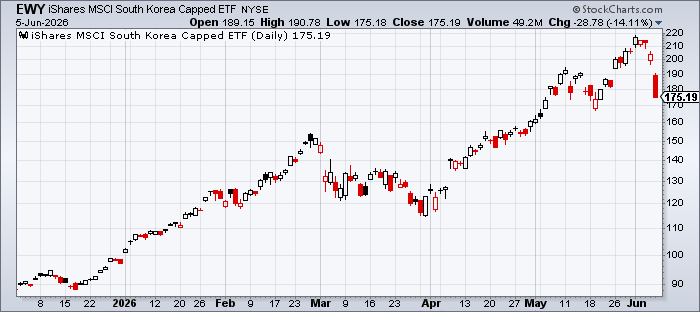
3. South Korea equities collapsed 14.89% in a single week The South Korean market — home to Samsung and SK Hynix, the backbone of global AI chip supply — suffered one of the steepest single-week drops of any major market this year. What matters: South Korea remains up 80% year-to-date, so this could be technical profit-taking, but given its outsized link to semiconductor demand, a continued unwind would signal that the AI infrastructure trade is undergoing a genuine reassessment, not just a breather.
4. Private credit is showing cracks under the surface Both Cliffwater and Monroe Capital capped investor redemptions at 5% after withdrawal requests hit 17% and 9% respectively — far above the limits allowed. What matters: this is a structural warning for investors in private market funds; the promise of stability in private credit is only as good as the fine print, and when stress arrives, the exit door is much narrower than many investors expect.
WATCH THIS NEXT WEEK
South Korea and the semiconductor trade. The 14.89% weekly drop is too large to ignore. Watch whether it stabilises or extends — a continued selloff in Korean equities would be an early warning that the broader AI and tech trade is unwinding in a way that goes beyond one week’s profit-taking. Given how much of 2026’s global equity performance has been driven by semiconductors and AI infrastructure, a repricing here would ripple across portfolios with any meaningful Asia or tech exposure.
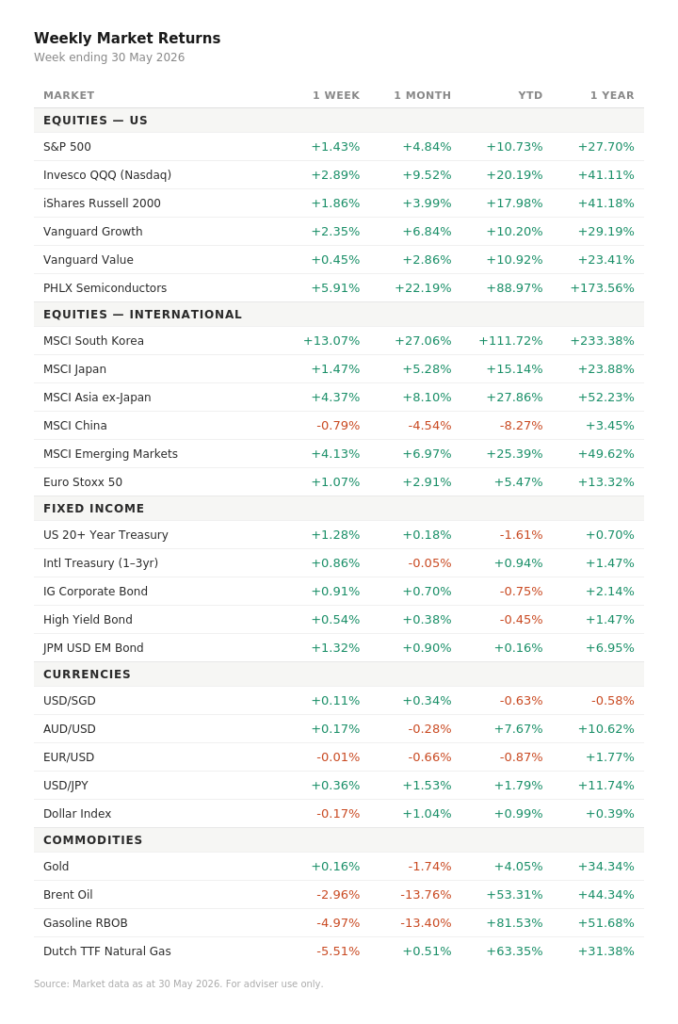
Markets were broadly risk-on this week, with equities rising across most regions and credit spreads tightening, but the mood was driven by a narrow theme rather than broad optimism — the semiconductor and AI hardware trade is doing most of the heavy lifting. The standout move was South Korea, up 13% in a single week, with PHLX semiconductors close behind at nearly 6%; everywhere else, gains were modest. Beneath the surface, the simultaneous rally in both equities and long-duration bonds points to markets pricing in lower rate hike odds.
TOP THEMES THIS WEEK
1. The AI spending boom is hitting a cost ceiling but not stopping. After an initial period of unchecked enthusiasm, companies are beginning to ration their AI usage as costs have escalated far faster than budgets anticipated, with some firms burning through annual AI spending allowances in under three months. This matters because it introduces the first real constraint on the demand side of the AI trade and raises the question of whether the revenue growth that chip and infrastructure companies are pricing in will actually materialise at the pace the market expects.
2. Hyperscaler debt has reached a scale that is reshaping credit markets. Companies like Meta and Alphabet have collectively borrowed over $250 billion to fund AI infrastructure, driving record activity in the credit default swap market as banks seek to offload their concentrated exposure to a handful of mega-borrowers. For investors, this is significant because it means the AI buildout is now a credit market story as much as an equity one.
3. Higher bond yields are here to stay regardless of what happens in the Middle East. Strategists are warning that even a full resolution of the US-Iran conflict and a reopening of the Strait of Hormuz would not bring long-term Treasury yields down materially, because the dominant drivers are now structural: large fiscal deficits, public debt concerns, and a higher long-run neutral rate.
4. US stocks are at dot-com era valuations, but consumers have never been gloomier. The S&P 500 is trading at valuation levels last seen at the peak of the dot-com bubble in 2000, yet US consumer sentiment recently hit its lowest point in 70 years. This disconnect that has no modern precedent. The difference from 2000 is that today’s high valuations rest on AI-driven profit margin expansion rather than shared public euphoria, but the underlying consumer stress, a $1.25 trillion in credit card debt, a 90-day delinquency rate of 13.12%, the highest in 15 years, is a slow-burning risk that equity markets are choosing to ignore.
WATCH THIS NEXT WEEK
South Korea. A 13% weekly gain in a country index is not normal. Korea is up 27% over the past month and 112% for the year — an extraordinary run that makes it the clearest live test of whether the semiconductor rally has genuine fundamental support or whether it has simply run ahead of itself. If this week’s move consolidates, it signals that the market believes the chip cycle has genuinely turned. If it reverses sharply, it will pull semiconductors, QQQ, and the broader AI hardware trade down with it. Either outcome tells us something important about where we are in this cycle.
Equity markets ended the week in a broad risk-on mood, with almost every major index posting gains and both large and small caps participating. The dominant force behind the rally remains artificial intelligence hardware — semiconductors were up 6% on the week and have nearly doubled in some Asian markets year-to-date. The one discordant note came from bonds, where long-dated US Treasuries remain under pressure for the year, quietly signalling that not everyone is convinced the good times will last.
The AI hardware trade is not slowing down — it is accelerating. South Korea and Taiwan are the world’s best-performing equity markets this year, powered almost entirely by chipmakers such as Samsung, SK Hynix, and TSMC. This matters because it confirms that the investment cycle is firmly in the physical layer of AI — the chips, the memory, the data centre hardware — rather than in software or platforms.
The Iran war remains the single biggest macro risk — and it is unresolved. The Strait of Hormuz closure has effectively removed around one billion barrels of oil from global supply, and despite President Trump’s suggestion that talks are in their final stages, observers see no sign of either side backing down. Dec 2026 futures prices remain elevated, as markets see a slow recovery in oil supply even as a deal is seen as the most likely outcome.
Interest rates are not coming down — and bond markets are adjusting. The latest US Federal Reserve minutes show a majority of officials are prepared to raise rates further if inflation stays above target, reversing what many had hoped would be a year of cuts. Sovereign bond yields across the G7 are at two-decade highs, and governments are under pressure to fund growing deficits at a much higher cost. This “higher-for-longer” environment is the backdrop against which equity valuations must eventually be judged.
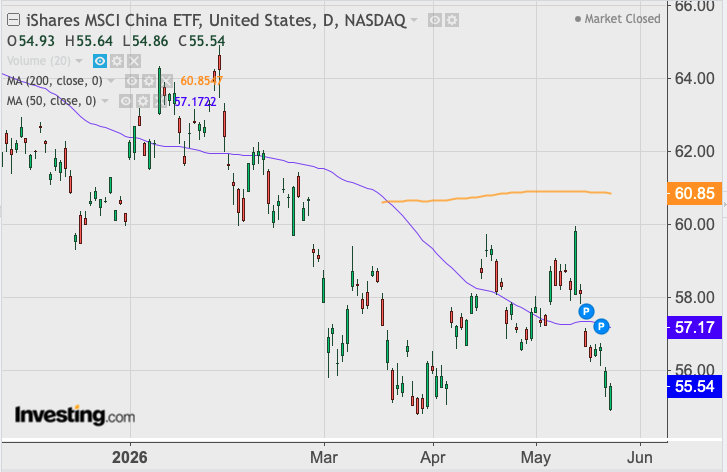
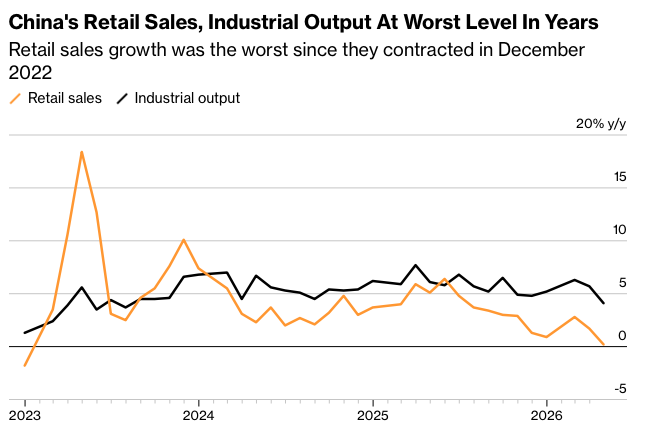
China is the market that the data and the price are both warning about. Domestic spending and investment missed forecasts in April, reflecting an economy where factories and exporters are thriving but ordinary consumers are not. The MSCI China index is the only major equity benchmark in the red for the year (-7.82% YTD), even as Chinese hardware exporters benefit from global AI demand. A few analysts see a mean-reversion opportunity in beaten-down Chinese sectors — but the price action this week does not yet support that view.
Markets sent a mixed and unsettling message this week. Energy surged, Brent oil up over 9%, natural gas up nearly 14%, while Asian equities reversed sharply after a strong month, and bonds fell across the board with yields rising. The overall mood is best described as inflation anxiety: the dollar rose, but gold fell, and safe havens offered no comfort, suggesting markets are more worried about the cost of the war.
TOP THEMES THIS WEEK
1. Oil is back above $100 — and it is not going away soon The Strait of Hormuz disruption knocked roughly 6 million barrels per day out of global supply in Q1, and while a handful of tankers have been allowed through, freight analysts warn that new vessels are not entering the waterway. This matters because energy prices are already up roughly 78% this year, are now feeding directly into US producer price data, and are keeping inflation expectations at their highest since 2022–23, which constrains what central banks can do next. Can Kevin Walsh cut rates?
2. The AI trade is borrowing its way forward — and the cracks are showing The big tech companies are raising extraordinary sums to fund AI infrastructure. Alphabet alone raised nearly $60 billion in four months, and tech now accounts for close to 40% of all high-grade US corporate bond issuance this year. At the same time, AI-related job cuts are up 33% year-on-year, Chinese tech giants are struggling to turn AI spending into profit, and the Apple–OpenAI partnership is fracturing. The investment implication is that the AI trade is increasingly dependent on continued debt appetite and hardware earnings delivery, both of which are now under scrutiny.
3. AI hardware euphoria hit a wallin Asia South Korea, the year’s biggest equity market winner at nearly +84% year-to-date, fell almost 6% this week. Semiconductors and Taiwan have been the central engines of this rally, fuelled by AI hardware demand, but valuations have become extreme and local retail investors are borrowing heavily to chase further gains. When a market that has risen 84% in five months falls 6% in a single week, it is worth paying close attention — this is how crowded trades begin to unwind.
4. Private credit is showing its first real stress signals KKR’s flagship private credit fund for retail investors reported a $560 million loss in Q1, with default rates rising to 8.1%. Separately, Apollo launched a new financial structure that bundles loans and fund stakes — observers have drawn comparisons to the CDO structures that preceded the 2008 financial crisis, though Apollo disputes the comparison. The broader signal is that while private credit has been presented as a stable, high-returning alternative to public bonds, the quality of underlying loans is now deteriorating in ways that are becoming hard to ignore.
WATCH THIS NEXT WEEK
South Korea (EWY) and the semiconductor trade. This is the sharpest reversal of the year’s strongest trend. EWY is up 84% year-to-date but fell nearly 6% this week alone — the biggest single-week drop in the entire watchlist. The Kospi’s concentration in electronic equipment (over 50% of the index) and the explosion of retail margin trading among local investors are classic late-cycle signals in a crowded trade. If EWY continues lower, expect the weakness to spread into semiconductors globally, then into QQQ and US tech. If it stabilises, the broader AI hardware rally likely has more room. Either way, this is the clearest signal of what comes next.
INVESTMENT IMPLICATIONS
The combination of surging energy prices, rising bond yields, and a stronger dollar — all at the same time — is a stagflation signal, not a straightforward growth or recession one. This is the most difficult environment for a balanced portfolio because neither equities nor bonds are offering reliable protection simultaneously. Investors heavily exposed to Asian tech and semiconductors after a remarkable YTD run should be asking whether their gains reflect earnings reality or euphoria — the price action and the private credit stress both suggest the latter is increasingly present. The more durable positioning in this environment points towards shorter-duration bonds, selective exposure to energy, and genuine diversification away from single-country or single-sector concentration.