MARKETS IN BRIEF
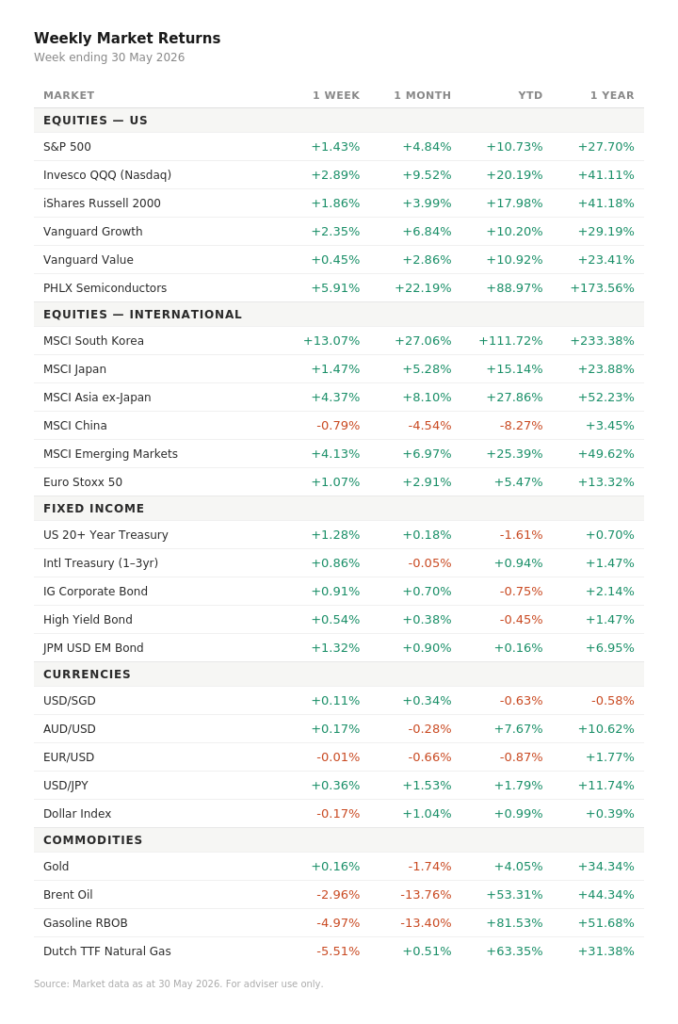
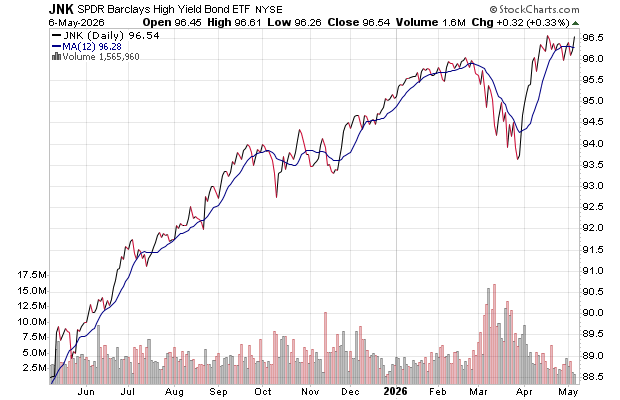
It was a broad selloff. Almost every asset class fell together. Equities, bonds, and gold saw losses, with the US dollar and defensive value stocks holding their ground.
TOP THEMES THIS WEEK
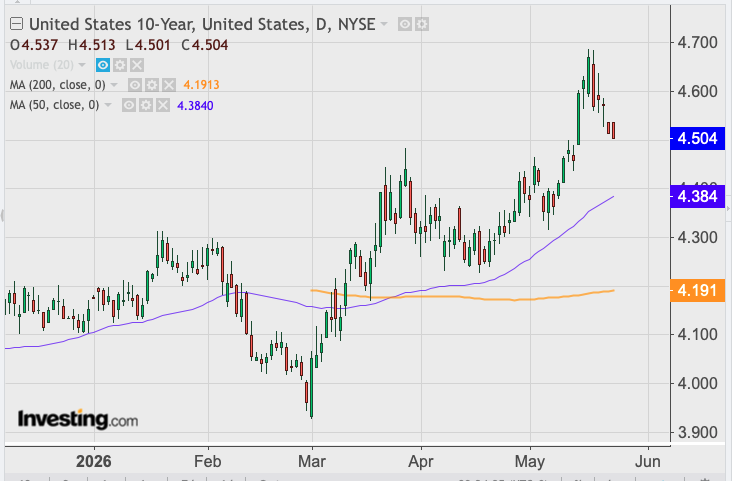
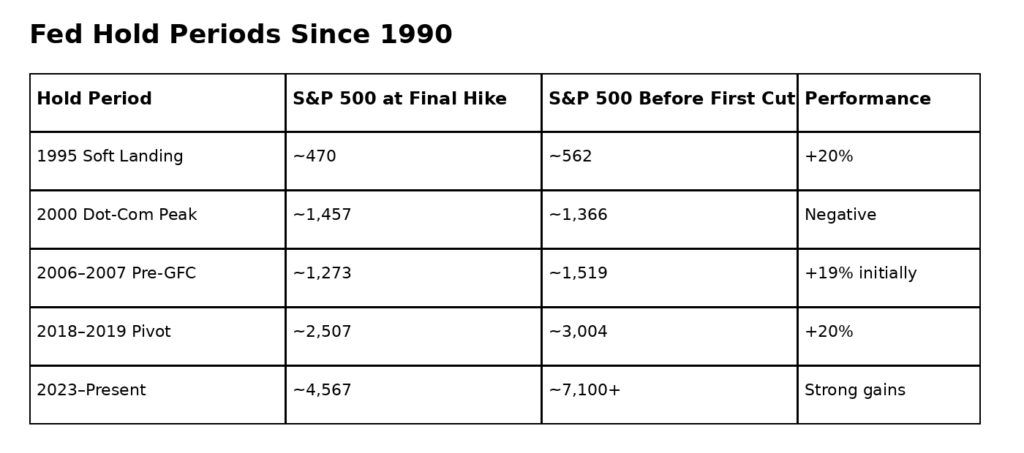
1. The “higher for longer” trade is back and market are repricing fast Strong US jobs data (172,000 added in May) and the fastest expansion in manufacturing in four years have forced a rethink on where interest rates are headed. Market observers are still divided: JPMorgan and BNP Paribas now expect a rate hike as early as December 2026, while Goldman Sachs and Citigroup still expect cuts. Bond market’s broad weekly selloff suggests traders are siding with the hawks.
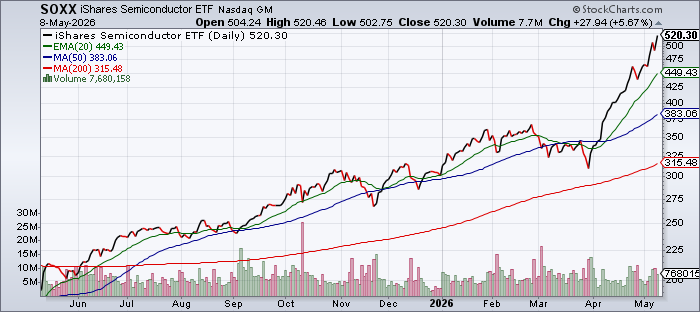
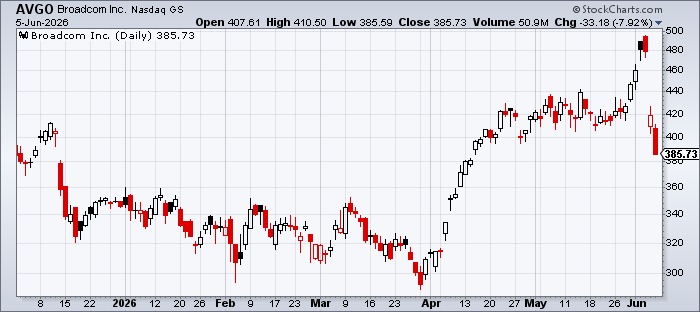
2. The AI trade hit a reality check Broadcom’s shares fell sharply after its AI chip revenue outlook, while strong in absolute terms, fell short of the extreme growth investors had already priced in. What matters: this is the clearest signal yet that the AI trade is no longer being rewarded for being good. It now has to be extraordinary, and the gap between investor expectations and corporate delivery is narrowing dangerously.
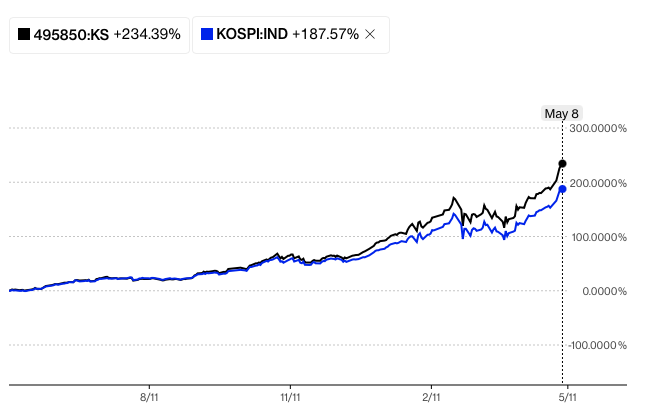
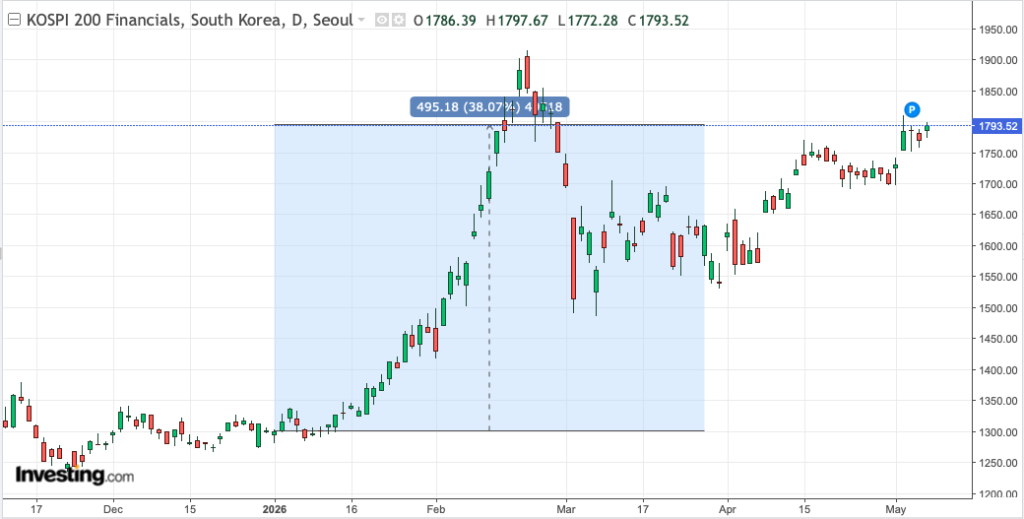
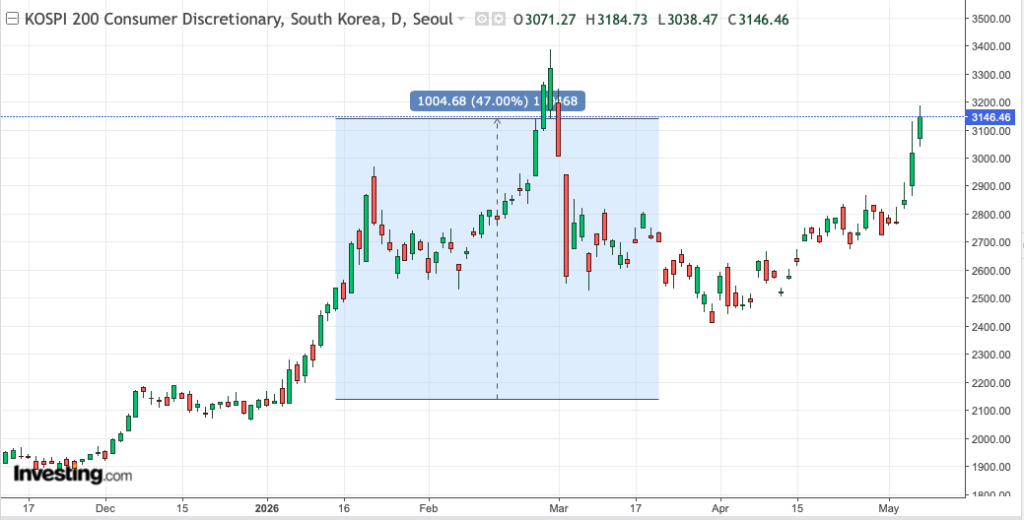
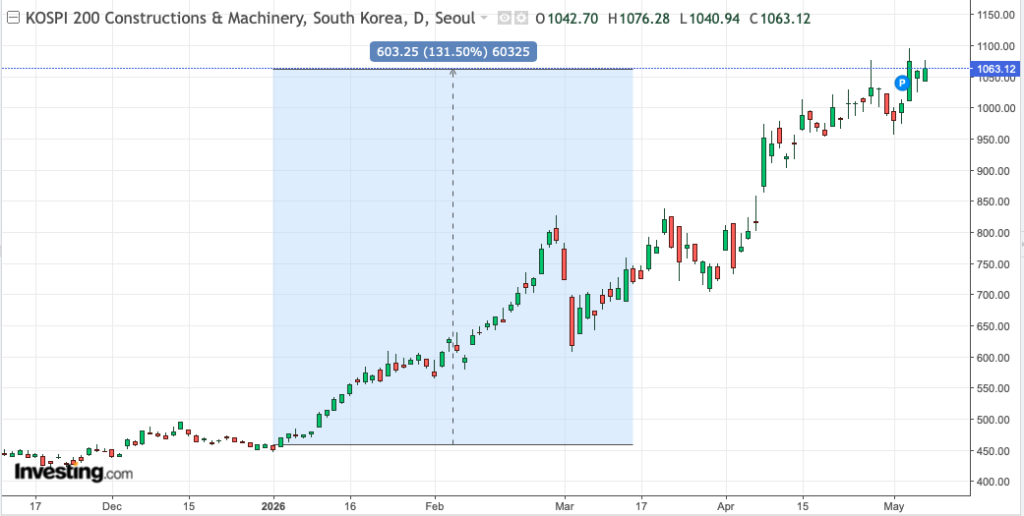
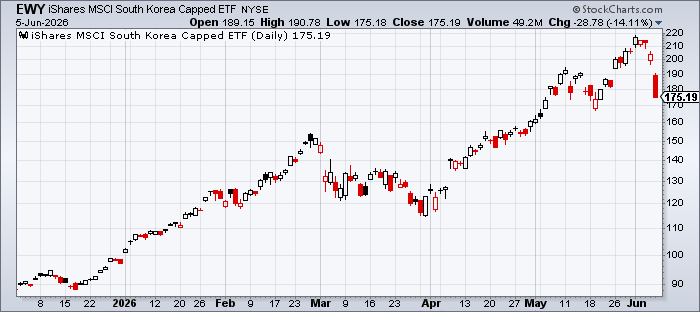
3. South Korea equities collapsed 14.89% in a single week The South Korean market — home to Samsung and SK Hynix, the backbone of global AI chip supply — suffered one of the steepest single-week drops of any major market this year. What matters: South Korea remains up 80% year-to-date, so this could be technical profit-taking, but given its outsized link to semiconductor demand, a continued unwind would signal that the AI infrastructure trade is undergoing a genuine reassessment, not just a breather.
4. Private credit is showing cracks under the surface Both Cliffwater and Monroe Capital capped investor redemptions at 5% after withdrawal requests hit 17% and 9% respectively — far above the limits allowed. What matters: this is a structural warning for investors in private market funds; the promise of stability in private credit is only as good as the fine print, and when stress arrives, the exit door is much narrower than many investors expect.
WATCH THIS NEXT WEEK
South Korea and the semiconductor trade. The 14.89% weekly drop is too large to ignore. Watch whether it stabilises or extends — a continued selloff in Korean equities would be an early warning that the broader AI and tech trade is unwinding in a way that goes beyond one week’s profit-taking. Given how much of 2026’s global equity performance has been driven by semiconductors and AI infrastructure, a repricing here would ripple across portfolios with any meaningful Asia or tech exposure.