According to this article, the US stock market’s rally to new highs has been propelled by so few stocks that it’s reminding some on Wall Street of the run up to the dot-com bubble.
I disagree.
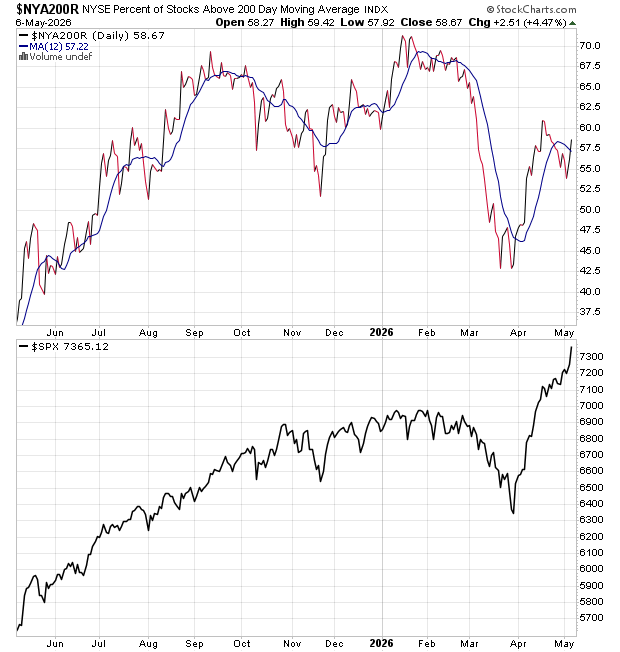
- Breadth Indicator – % of Stocks Above 200DMA
~59% of S&P 500 stocks are above their 200-day moving average. Moderate participation, not extreme weakness.
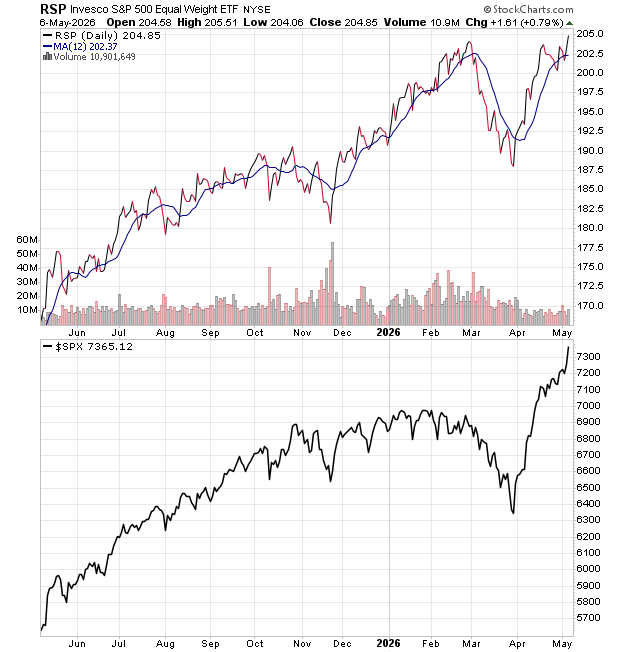
- Cap-Weighted vs Equal-Weighted Performance
S&P 500: New highs.
Equal-weight S&P 500 (RSP): Recovered all the Iran losses.
Participation exists despite some concentration.
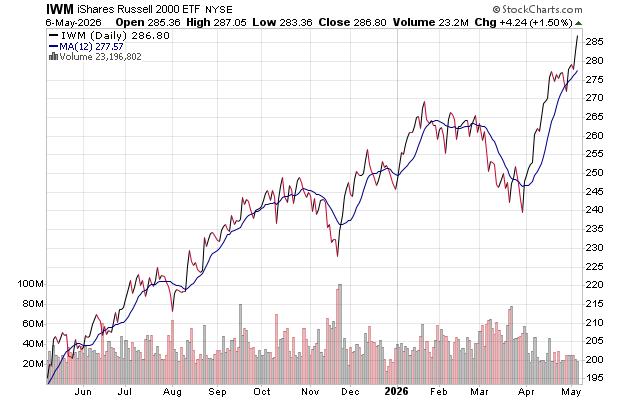
- Small Cap Participation
Russell 2000 trading in tandem with S&P 500. Strong small-cap performance suggests broadening rally.
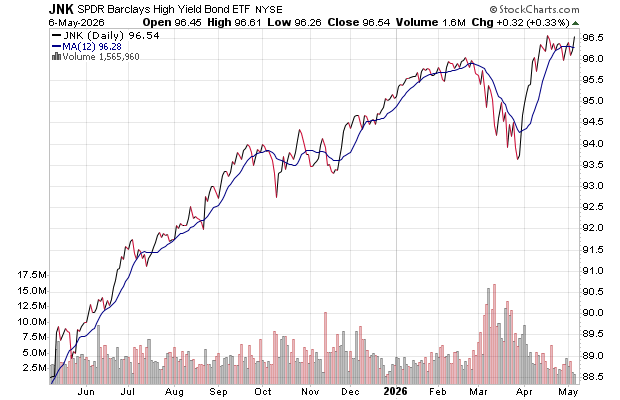
High yield bonds
JNK is trading at new highs, credit market is joining in the rally.
Leave a Reply