Blog

  • Market Wrap for Week ending 30 October 2026

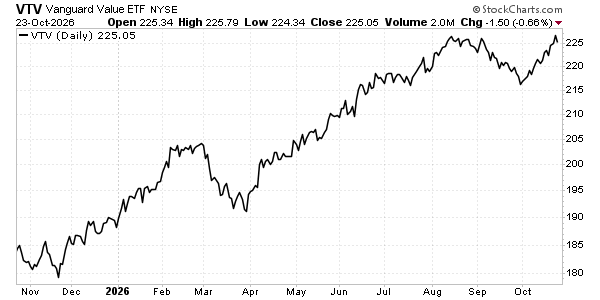
    Markets were in a risk-off mode: the S&P 500 fell 0.57% and QQQ lost 1.97%, while value shares gained 1.32% and long-dated US Treasuries rose 0.63%. High-yield bonds remained positive, but falling gold and rising energy prices made this an uneven defensive move.

    TOP THEMES THIS WEEK

    1. Investors demand results from AI spending. This week’s coverage contrasted Microsoft’s strong Azure growth with concerns about Alphabet’s weaker advertising momentum and heavy investment commitments. For investors, this reinforces the need to assess each company’s ability to turn AI spending into profitable growth, rather than treating the whole sector as one investment opportunity.
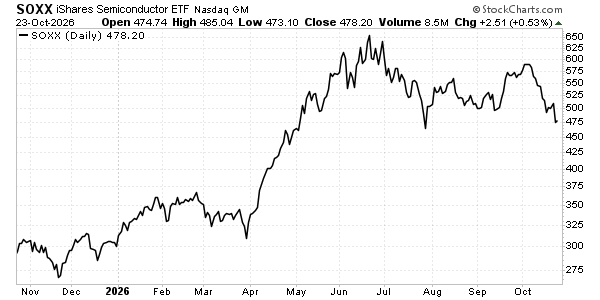
    2. Technology dependence is becoming a vulnerability. The reading highlighted dependence on a small group of AI-related earnings drivers, while the semiconductor fund in the market snapshot fell 8.24% in the latest session and stood 19.93% lower over the month. This combination makes exposure to common customers and spending plans more important than the number of stocks held, although the sell-off does not itself prove demand is weakening.
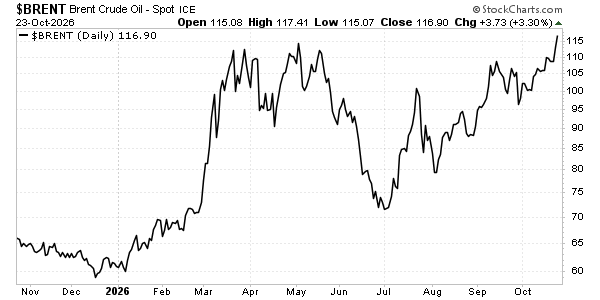
    3. Energy remains a threat to inflation and growth. Brent rose 1.25% and Dutch natural gas gained 10.75% during the week, against a backdrop of disrupted shipping and depleted oil inventories documented in the IEA’s October report. Sustained energy costs would squeeze household purchasing power and business margins, while complicating the case for lower interest rates. 
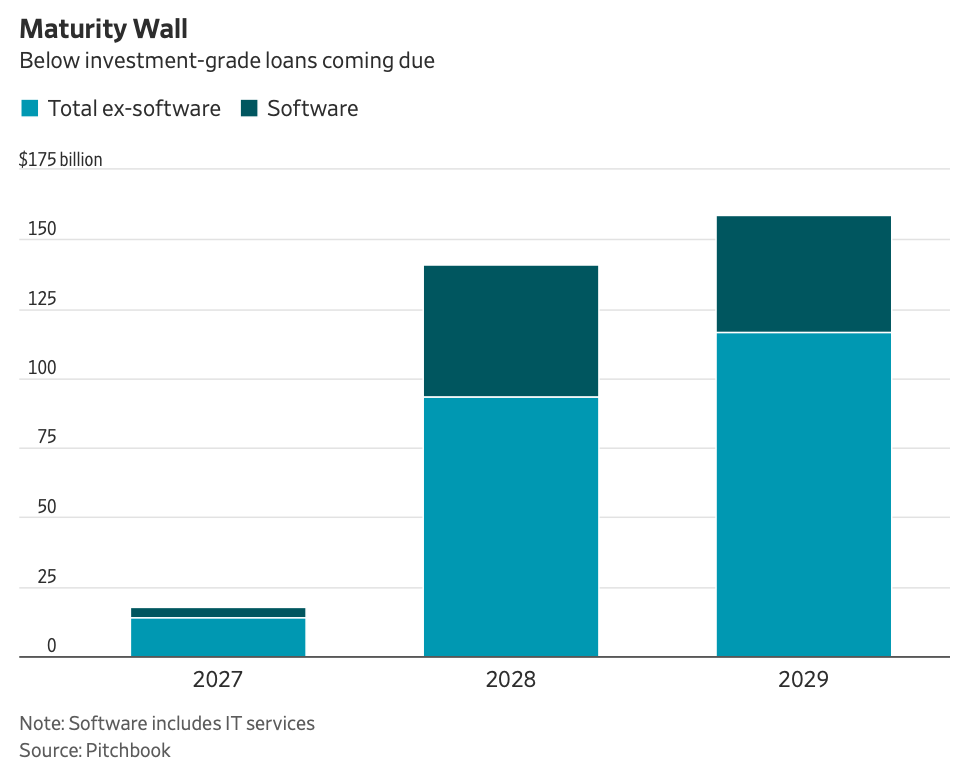
    4. Software debt deserves closer scrutiny. The reading raised concerns about approaching debt repayments at private-equity-backed software companies and the additional competitive pressure from AI. Investors should examine borrowers’ cash generation and refinancing needs individually; this week’s gain in listed high-yield bonds does not resolve those private-market concerns.

  • Market Wrap For The Week Ending 23 Oct 2026

    MARKETS IN BRIEF

    Global equities weakened as investors became increasingly concerned about the sustainability of AI investment and renewed energy supply disruptions. The S&P 500 declined 0.47%, while semiconductor stocks fell 3.08%, extending their one-month decline to 16.50%. However, US small-cap and value stocks gained, while government and corporate bonds held up, suggesting a selective risk-off environment rather than widespread financial-market stress.

    TOP THEMES THIS WEEK

    1. AI financing pressures are mounting

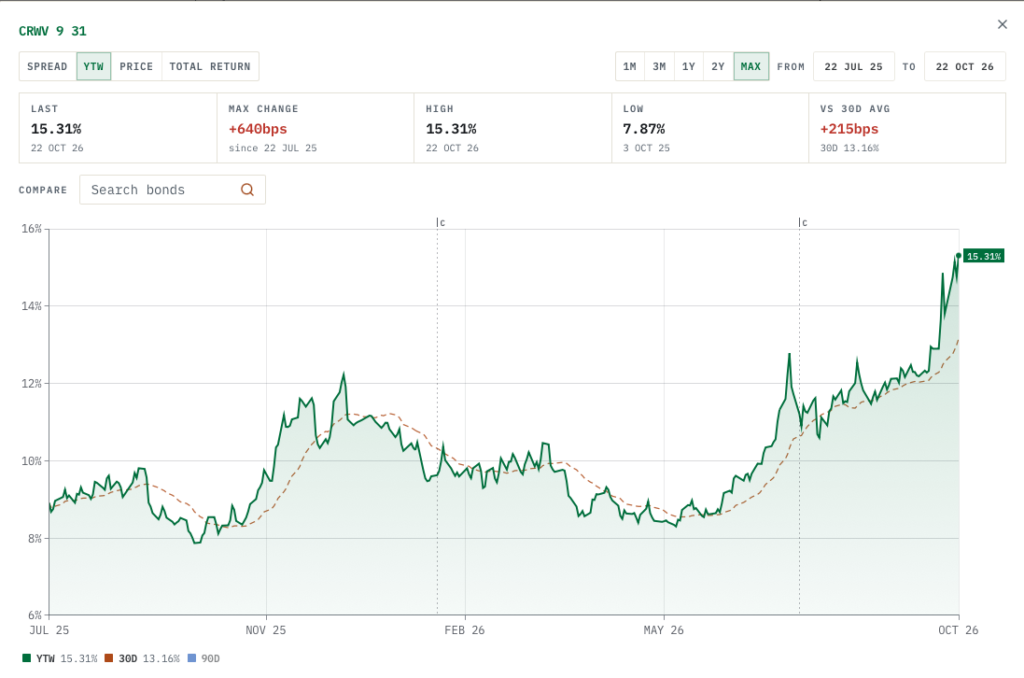
    Highly leveraged AI infrastructure companies are facing increasing borrowing costs, with CoreWeave’s unsecured bond yields recently reaching around 15–16% and investors becoming more selective about financing data centre projects. This raises the risk that tighter financing conditions could slow AI infrastructure investment, particularly among companies dependent on external funding.

    2. Investors are challenging AI valuations

    Nscale faced resistance to its proposed US$30 billion IPO valuation, with some investors favouring US$16–19 billion, while Microsoft withdrew from one of its UK data centre projects because of power delays. These developments suggest that access to capital can no longer be taken for granted, potentially forcing companies to scale back or delay expansion plans.

    3. Questions are growing over returns on AI investment

    Apollo’s research highlighted slowing growth in corporate AI token spending and declining returns on invested capital among major hyperscalers, while Anthropic’s draft financial disclosures revealed substantial long-term computing commitments. The concern is that investment in AI capacity may be growing faster than the revenues and profits it can generate, undermining the economics supporting current valuations.

    4. Energy prices are adding another layer of risk

    Brent crude rose 6.44% this week, while European natural gas prices increased 7.20%, reflecting renewed concerns about prolonged Middle Eastern energy supply disruptions. Sustained high energy prices could increase inflationary pressures and constrain central banks’ ability to support economic growth if the AI investment cycle weakens.

    WATCH THIS NEXT WEEK

    Hyperscaler earnings and AI capital expenditure guidance.

    Upcoming results from Alphabet, Microsoft and Amazon will provide an important test of whether growing AI infrastructure spending is translating into stronger earnings and cash flows. Investors will be looking beyond headline revenue growth to determine whether these companies can sustain their investment plans without materially weakening their financial positions.

  • Market Wrap For Week Ending 16 October 2026

    Global equities suffered a broad selloff, led by semiconductors (-11.8%), South Korea (-15.1%) and the Nasdaq-100 (-5.5%). Investors rotated out of crowded technology positions into value stocks and high-quality bonds, while rising energy prices added to inflation concerns. The mood was risk-off, but not outright panic, with gold and the US dollar failing to attract their usual safe-haven demand.

    TOP THEMES THIS WEEK

    1. AI infrastructure financing faces its first serious credit test

    CoreWeave’s bond yields surged towards 15%, reflecting growing concerns about the sustainability of debt-financed AI infrastructure expansion. The key risk is that high borrowing costs and weakening returns could force developers to scale back investment, potentially spreading financial stress to lenders, chipmakers and the broader technology sector. 

    2. Bond markets may be doing central banks’ tightening for them

    US 10-year Treasury yields climbed above 5% amid persistent inflation and energy-price pressures, before retreating as equity markets weakened. Higher borrowing costs could slow economic activity without further central bank rate increases, but stubborn inflation complicates the outlook and limits how far policymakers can ease. 

    3. Semiconductor leadership comes under pressure

    China’s CXMT announced advances in memory-chip technology, triggering sharp losses in Korean chipmakers, even as TSMC forecast strong fourth-quarter revenue and maintained ambitious capital-spending plans. The contrast suggests investors are increasingly questioning technology valuations and future profitability rather than simply assuming that strong AI demand will translate into attractive investment returns. 

    4. Falling AI prices raise questions about infrastructure returns

    Intensifying competition from cheaper AI models and improvements in computing efficiency are driving down the cost of using AI, while smaller models increasingly support processing on local devices. Lower prices could accelerate adoption, but they also raise questions about whether revenue growth will justify the enormous investment in centralised data centres, particularly for heavily indebted operators.

    WATCH THIS NEXT WEEK

    Semiconductors — whether selling spreads beyond technology.

    Semiconductors lost 11.8% this week despite remaining up 63.8% year-to-date, suggesting considerable scope for further profit-taking. The key question is whether the decline stabilises or spreads to broader equities and credit markets. Continued weakness in chip stocks alongside widening corporate credit spreads would suggest a more serious reassessment of AI investment economics, rather than a temporary reversal of crowded positions.

  • Is the AI Investment Boom Running Out of Steam?

    9 October 2026

    The artificial intelligence (AI) investment boom continues to gather momentum, with technology companies committing enormous sums to data centres, computer chips and supporting infrastructure. Yet an increasingly important question is emerging: will these investments generate enough revenue to justify their cost?

    The concern is not whether AI will transform the economy. It is whether the infrastructure being built today will produce sufficient financial returns for the companies and investors funding it.

    Our assessment is that the AI infrastructure boom remains in a late-cycle expansion. Demand for computing capacity is still strong, but the financial risks associated with sustaining this investment are becoming more apparent.

    AI Spending Shows Little Sign of Slowing

    The world’s largest technology companies continue to invest heavily in AI infrastructure.

    Microsoft, Alphabet, Amazon and Meta have collectively committed hundreds of billions of dollars to building data centres, purchasing advanced semiconductors and expanding computing capacity.

    Recent company disclosures illustrate the extraordinary scale of this investment:

    • Microsoft reported quarterly capital expenditure of approximately US$41 billion, including finance leases.
    • Alphabet spent US$80.6 billion in the first half of 2026, more than double the amount spent a year earlier.
    • Amazon’s quarterly cash capital expenditure reached US$53.1 billion, up from US$31.4 billion a year earlier.
    • Meta raised the lower end of its 2026 capital expenditure guidance to US$130 billion, from US$125 billion previously.

    Much of this spending reflects the belief that demand for AI computing services will continue to grow rapidly.

    Importantly, there is no convincing evidence that the major technology companies are collectively preparing to scale back investment.

    The semiconductor industry tells a similar story. Nvidia reported data-centre revenue of US$89 billion for its fiscal second quarter ending July 2026, more than doubling from a year earlier. Meanwhile, Taiwan Semiconductor Manufacturing Company’s September revenue rose by 54.6% year on year, although its business extends beyond AI chips.

    These figures suggest that demand for advanced computing hardware remains strong.

    However, strong spending does not necessarily mean that the investments will ultimately be profitable.

    Are AI Investments Generating Enough Revenue?

    This is becoming the most important question surrounding the AI boom.

    There are encouraging signs that companies are generating revenue from AI-related services.

    For example, Google Cloud’s second-quarter revenue rose 82% year on year, while Amazon Web Services recorded growth of 37%. Oracle also reported exceptionally strong growth in its cloud infrastructure business.

    Although these businesses benefit from AI adoption, their reported revenue includes traditional cloud services. It is therefore difficult to determine exactly how much additional revenue is being generated specifically by AI.

    More importantly, companies generally do not disclose sufficient information to calculate the profitability of their AI infrastructure investments separately.

    This creates a significant gap in our understanding of the investment boom.

    Consider a simplified example. A company increases its annual AI infrastructure investment by US$20 billion and generates an additional US$5 billion in annual revenue. That additional revenue may appear encouraging, but it tells us little about profitability until operating expenses, depreciation, financing costs and the useful life of the equipment are considered.

    The relevant question is not simply whether AI revenue is growing.

    It is whether additional AI revenue and profits are growing sufficiently to justify the additional capital being invested.

    The distinction matters because technology infrastructure is expensive to build, and some equipment can become technologically outdated relatively quickly.

    An investment boom can therefore continue even while its underlying financial returns are deteriorating.

    The First Signs of Financial Strain

    One of the more concerning developments is the growing reliance on external financing to support AI infrastructure expansion.

    Historically, the largest technology companies have generated enormous amounts of cash from their existing businesses. This has enabled them to finance substantial investments internally.

    However, as infrastructure spending accelerates, an increasing share of operating cash flow is being absorbed by capital expenditure.

    Amazon, for example, reported negative free cash flow of US$7.6 billion over the 12 months ending in the second quarter of 2026, compared with positive free cash flow of US$25.9 billion a year earlier.

    This does not imply that Amazon is facing financial difficulties. Nevertheless, it illustrates how rapidly infrastructure investment can consume internally generated funds.

    The situation is potentially more challenging for companies without similarly profitable core businesses.

    Oracle is a particularly important example. The company has substantially increased its investment in AI infrastructure while pursuing large-scale debt and equity financing.

    This raises questions about the financial risks being transferred to lenders, infrastructure investors and other providers of capital.

    There are also early signs that investors are becoming more selective.

    In October, Australian data-centre developer Firmus abandoned a proposed US$5 billion initial public offering amid valuation concerns and insufficient investor demand.

    Meanwhile, developments in corporate credit markets suggest that investors are increasingly scrutinising the borrowing requirements associated with AI infrastructure.

    These are not signs of a widespread funding crisis. Capital remains available, particularly for established borrowers with strong balance sheets.

    However, they suggest that investors are beginning to distinguish between companies with sustainable funding models and those whose investments depend heavily on continued access to external capital.

    This could become an important turning point.

    AI infrastructure spending does not have to become unprofitable across the entire industry for investment to slow. Financing becoming more expensive or difficult for weaker borrowers could be enough to delay or cancel projects.

    Is the World Building Too Many Data Centres?

    At present, the physical data-centre market does not suggest widespread oversupply.

    According to property consultancy CBRE, vacancy rates across major US data-centre markets fell to just 1.4% in the first half of 2026, compared with 1.6% a year earlier.

    Furthermore, approximately 80% of capacity under construction had already been pre-leased, up from around 74% previously.

    These figures indicate that demand continues to absorb newly developed capacity.

    Electricity availability, grid connections and equipment shortages are also restricting the pace at which new data centres can be completed.

    However, these constraints create an important distinction.

    A project delayed because electricity is unavailable does not necessarily indicate weakening demand. It may simply mean that infrastructure development cannot keep pace with customer requirements.

    By contrast, a company cancelling a project despite having secured sufficient power would be a much more concerning development.

    Such cancellations could suggest that expected financial returns have deteriorated or that customers no longer require as much capacity as originally anticipated.

    For now, the evidence points more towards infrastructure shortages than excess capacity.

    But this could change if the large volume of projects currently under development eventually becomes operational.

    Falling AI Computing Costs: Good News or Bad News?

    Another risk to the infrastructure boom comes from technological progress itself.

    AI chips and models are becoming more efficient. Improvements in semiconductor performance, software optimisation and model design mean that certain AI tasks can be completed using less computing power.

    This is positive for businesses and consumers because it makes AI services cheaper and more accessible.

    However, it creates uncertainty for companies investing heavily in AI infrastructure.

    If the amount of computing power needed to perform a particular task falls substantially, the value of older equipment and the revenue it can generate may also decline.

    For example, an investor purchasing expensive graphics processing units (GPUs) today faces the possibility that newer chips or more efficient AI models could significantly reduce the market price of comparable computing services.

    The important issue is whether falling costs encourage enough additional AI usage to offset the efficiency improvements.

    If demand expands faster than computing efficiency improves, total infrastructure requirements could continue growing.

    But if efficiency improves faster than demand, the industry could experience slowing investment even while AI adoption continues to accelerate.

    This is why falling prices for AI computing services should not automatically be interpreted as evidence of weakening demand.

    Investors need to distinguish between prices declining because technology has improved and prices declining because there is too much capacity.

    How Might the AI Boom Eventually Peak?

    The end of the AI infrastructure boom may not begin with an obvious collapse in semiconductor orders or a sudden reduction in technology company spending.

    A more plausible warning could emerge gradually through deteriorating investment economics.

    Consider the following sequence:

    1. AI infrastructure investment grows faster than the revenue and cash flow it generates.
    2. Companies increasingly depend on borrowing, leasing and other financing arrangements.
    3. Lenders demand higher interest rates or stronger protection against losses.
    4. Infrastructure developers become more selective about new projects.
    5. Companies postpone investments that no longer offer sufficiently attractive returns.
    6. Semiconductor orders and data-centre construction eventually slow.

    There is some early evidence of financial pressure, but the complete sequence has not yet developed.

    Importantly, the first warning may come from financial markets rather than technology companies themselves.

    Credit spreads — the additional interest lenders demand above safer government bonds — could become particularly useful indicators.

    If borrowing costs for AI infrastructure projects rise persistently relative to the wider corporate bond market, it could indicate that lenders are becoming increasingly concerned about financial returns and repayment risks.

    Another important indicator is the rental price and utilisation of advanced AI chips.

    If computing capacity expands faster than demand, equipment utilisation could fall, forcing operators to reduce rental prices.

    Such a development would directly undermine the financial returns generated by existing infrastructure.

    For now, available pricing evidence is mixed, and there is insufficient reliable utilisation data to conclude that widespread oversupply is emerging.

    What Would a Slowdown Mean for Investors?

    Not all AI-related investments would necessarily suffer equally if infrastructure spending slows.

    Companies supplying advanced chips, semiconductor manufacturing equipment, specialised memory and data-centre electrical systems are particularly exposed to the pace of new infrastructure construction.

    A meaningful reduction in spending could weaken their revenue growth and earnings expectations.

    Data-centre operators and infrastructure lenders may also face pressure if customers defer projects, renegotiate contracts or encounter financing difficulties.

    However, the implications for major technology companies could be more complicated.

    If infrastructure spending slows because demand for AI services disappoints, it would likely be negative for both equipment suppliers and technology companies.

    On the other hand, if spending slows because AI becomes significantly more efficient, the outcome could be quite different.

    Companies such as Microsoft, Alphabet and Amazon might benefit from lower infrastructure costs, improving cash flow and potentially higher profit margins.

    Businesses adopting AI could also benefit from cheaper computing services and stronger productivity gains.

    In other words, a slowdown in AI infrastructure investment would not necessarily mean that AI adoption or its economic benefits are slowing.

    It could instead mark a transition from an investment-heavy phase towards one in which businesses capture more of the financial benefits of the technology.

    For investors, distinguishing between these two scenarios will be essential.

    How Likely Is an AI Investment Slowdown?

    Our current assessment is that there is a high, although highly uncertain, probability — broadly 50% to 75% — that AI infrastructure capital expenditure growth will slow materially over the next 12 months.

    This is a judgemental assessment rather than a statistical forecast.

    It is also important to distinguish between slower growth and an outright contraction.

    A company increasing investment by 15% next year rather than 50% this year would represent a substantial slowdown in capital expenditure growth, even though the amount invested would still increase.

    Given the extraordinary pace of investment in recent years, some moderation would not be surprising.

    An outright decline in infrastructure spending would require stronger evidence than is currently available.

    We would become significantly more concerned if several developments occurred together:

    • Major technology companies begin lowering their forward capital expenditure guidance.
    • GPU rental prices decline persistently alongside weakening utilisation.
    • AI infrastructure borrowing costs rise significantly relative to the broader corporate bond market.
    • Developers begin cancelling projects despite having secured electricity supply and customers.
    • AI-related profitability fails to improve despite continued investment.

    Conversely, stronger evidence of AI-related profits, healthy computing demand and improving free cash flow would reduce the likelihood of a damaging downturn.

    Conclusion: Strong Demand, Increasing Financial Risks

    The AI infrastructure boom is not over. Demand for advanced semiconductors remains strong, data-centre occupancy is high, and major technology companies continue to invest enormous sums.

    Nevertheless, the financial risks are becoming increasingly important.

    The key concern is not that AI will fail to transform the economy. It is that the investment required to support this transformation may be growing faster than the profits it can realistically generate.

    History offers numerous examples of transformative technologies accompanied by excessive infrastructure investment. Railways, telecommunications and the internet all delivered substantial long-term economic benefits, but not every company financing their expansion earned attractive returns.

    AI could follow a similar pattern.

    For investors, the most important question is therefore shifting.

    It is no longer simply how much companies will spend on AI. It is how much financial return they can earn on that spending.

    That may ultimately determine when the AI investment boom peaks, which companies emerge stronger and which investors are left bearing the costs.


    This commentary reflects information available as of 9 October 2026. The probability assessment is illustrative and judgemental, not a statistically derived forecast. It should not be interpreted as a prediction that AI adoption or absolute infrastructure spending will decline.

    Sources and further reading

    (Assisted by AI)
  • US Banks Report Solid Profits But Higher Rates Are A Risk

    The latest earnings from America’s largest banks confirm the resilience of the US economy. But beneath the strong profits, there are emerging risks that investors should not overlook.

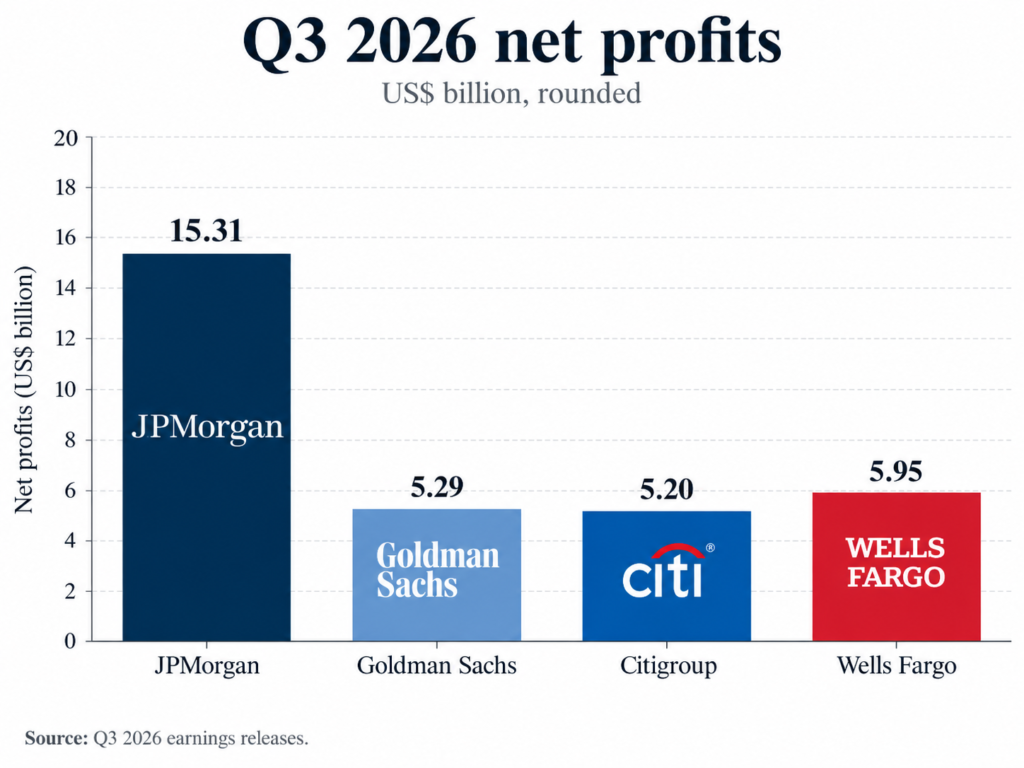
    Four of America’s biggest banks — JPMorgan Chase, Goldman Sachs, Citigroup and Wells Fargo — have reported their Q3 results. Together, they generated approximately US$31.8 billion in net profits in just three months.

    The results offer an encouraging picture of the US banking industry. Lending is growing, consumers are largely keeping up with their debt repayments, and investment banking activity remains healthy.

    However, there is an important distinction between banks performing well today and their earnings continuing to improve over the coming year.

    JPMorgan led with US$15.3 billion in net profits, up approximately 6% from a year earlier. Citigroup’s earnings jumped around 38%, while Goldman Sachs recorded a 29% increase. Wells Fargo’s profits also improved by approximately 6%.

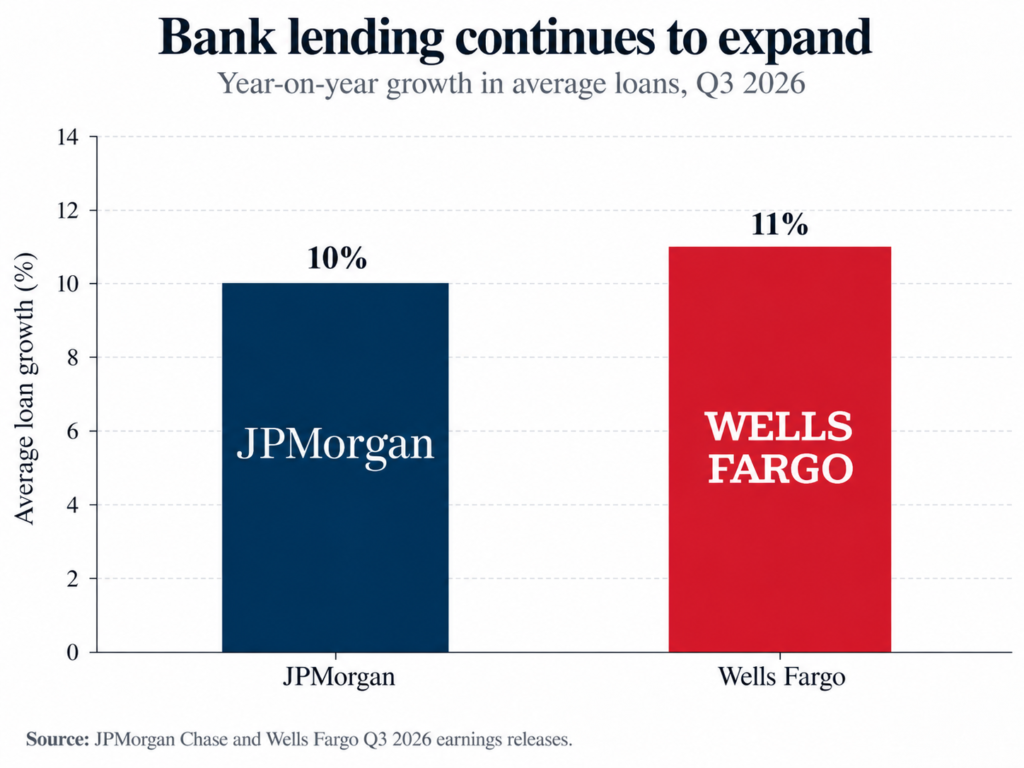
    JPMorgan’s average loan balances grew 10% year-on-year, while Wells Fargo recorded an 11% increase. Both banks also reported deposit growth, suggesting that demand for banking services remains healthy despite elevated interest rates.

    Meanwhile, investment banking and trading provided another source of strength. Goldman Sachs benefited from a 72% surge in equities trading revenue, while investment banking fees rose 21%.

    The message is encouraging: US banks are not relying on a single source of income to generate profits.

    American consumers are still holding up

    One of the most reassuring findings concerns US households.

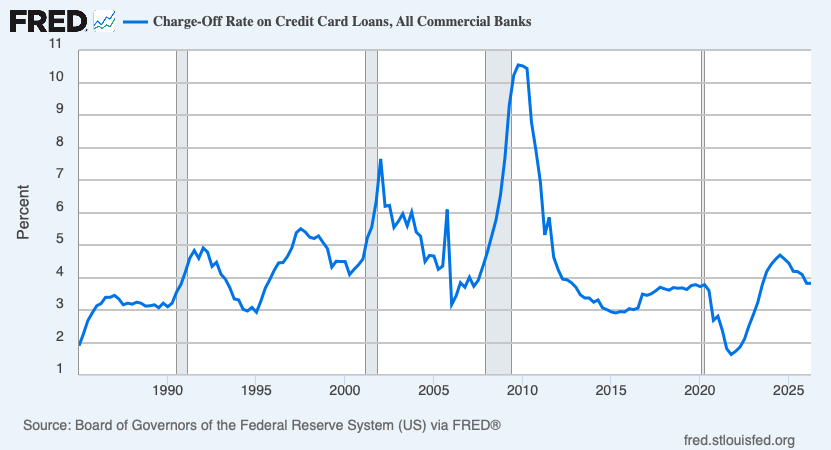
    JPMorgan reported that debit and credit card spending increased 10% year-on-year, while its credit card net charge-off rate stood at 2.91%.

    This suggests that many consumers are continuing to spend and service their debts despite persistent inflation and higher borrowing costs.

    Lending growth remains surprisingly strong

    These increases are significant because higher interest rates would ordinarily be expected to discourage borrowing.

    But loan growth does not necessarily mean the economy is accelerating. Companies may borrow more to finance expansion, refinance existing obligations or support cash flow. Banks may also increase lending by gaining market share.

    For investors, the important question is not simply whether lending is expanding, but whether borrowers can comfortably repay their obligations.

    The housing slowdown has yet to become a problem

    The US housing market remains under considerable pressure from high mortgage rates. Home sales are subdued, refinancing activity has weakened, and affordability remains a major challenge. Yet these difficulties have not translated into widespread banking losses.

    JPMorgan’s home-lending revenue declined 3% year-on-year, illustrating how weaker mortgage activity is affecting parts of the financial industry. However, its other businesses more than compensated for this weakness.

    At Wells Fargo, commercial loan charge-offs increased, but non-performing assets declined during the quarter.

    These are mixed signals rather than clear evidence of deteriorating financial conditions.

    It is also worth remembering that many American homeowners still hold long-term fixed-rate mortgages obtained when interest rates were substantially lower. This provides some protection against the latest increase in borrowing costs.

    The greater danger would arise if the housing slowdown coincided with rising unemployment and falling property prices, pushing more borrowers into financial difficulty.

    Higher interest rates are a double-edged sword

    Banks can benefit from higher interest rates because they earn more on certain loans and interest-bearing assets.

    JPMorgan’s net interest income increased approximately 13% year-on-year, supported by larger lending and deposit balances.

    However, rising rates also carry costs.

    Banks holding older fixed-rate bonds may experience losses as market yields rise. JPMorgan, for instance, reported US$658 million in investment securities losses during the quarter.

    Higher rates can also raise banks’ funding costs, discourage new borrowing and eventually increase credit losses.

    This is particularly relevant following the latest increase in US Treasury yields and mortgage rates.

    The latest quarterly results cover July to September and therefore do not fully reflect the impact of October’s bond-market volatility.

    What should investors watch next?

    Three indicators that matter for US banks

    • Loan growth and net interest income: Sustained growth would support earnings, provided lending standards remain sound and deposit costs are controlled.
    • Corporate credit quality: Rising provisions accompanied by higher actual defaults would be a more serious warning than reserve increases alone.
    • Treasury yields and regional banks: Persistent increases in long-term bond yields could pressure securities portfolios and banks with weaker funding structures.

    What does this mean for investors?

    The first round of bank earnings suggests that the US financial sector remains fundamentally healthy. Large banks are generating substantial profits, lending continues to expand, and consumer credit quality has held up better than many feared.

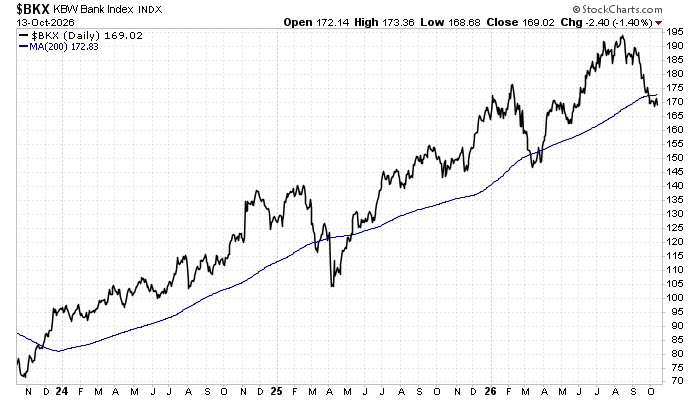
    However, strong earnings do not automatically translate into strong share-price performance. Bank valuations also depend on future earnings expectations, credit conditions and the direction of interest rates.

    Investors should also distinguish between large diversified institutions and smaller regional banks. The former benefit from multiple income streams and substantial funding advantages, while the latter may be more exposed to commercial property lending, deposit costs and bond-market losses.

    The upcoming regional-bank earnings will help determine whether the positive developments extend across the broader industry.

    The bottom line

    US banks are in better shape than the weak housing market and elevated borrowing costs might suggest.

    For now, solid lending activity, resilient consumers and healthy capital-market revenues are supporting profitability.

    The risk is that today’s strong earnings reflect economic conditions that could change if higher interest rates persist and growth slows.

    For investors, the more important question is whether those profits can continue growing without a deterioration in credit quality.

  • Private Credit: Equity Rebound Masks Persistent Weakness

    12 October 2026

    Private credit markets remain under pressure despite a rebound in alternative asset management stocks. During the week, Blue Owl and Apollo gained 4.5% and 4.1% respectively, while the VanEck BDC Income ETF and Virtus Private Credit fell by approximately 2% each. Meanwhile, the Senior Loan ETF remained relatively stable, suggesting that weakness has been more pronounced among listed private credit funds than in the broader leveraged loan market.

    This divergence suggests that investors are becoming more willing to buy asset management shares but remain cautious about direct lending exposures. Concerns about loan valuations, liquidity and dividend sustainability have not disappeared. The recovery in software shares is encouraging, particularly given private credit’s exposure to the sector, but it has yet to restore confidence in BDCs.

    Our assessment remains cautious rather than alarmist. The evidence points to continued repricing and selective stress, not a confirmed systemic credit crisis. A sustained recovery in BDC prices, supported by improving corporate credit spreads, would provide stronger evidence that conditions are stabilising.

  • Market Wrap For Week Ending 9 Oct 2026

    Global markets were mixed, with US equities showing resilience while Europe and most Asian markets weakened. The S&P 500 gained 1.15%, but semiconductors fell 5.01% and South Korean equities declined 7.63%, suggesting increasingly selective risk appetite. Bond markets recovered modestly towards the end of the week, although elevated yields, a stronger US dollar and persistent energy supply concerns continued to weigh on investor sentiment.

    1. Middle East conflict threatens energy supplies

    Iran intensified attacks on commercial vessels around the Strait of Hormuz, disrupting oil shipments and driving tanker transport costs sharply higher, even after flows had previously recovered towards pre-war levels. 

    The renewed disruption highlights the fragility of global energy supplies and raises the risk of another inflationary shock, particularly if higher oil and transport costs persist.

    2. Sovereign debt concerns drive global bond volatility

    Government borrowing costs climbed to multi-decade highs amid persistent inflation concerns and fiscal pressures, with US 10-year Treasury yields briefly exceeding 5.3% and French borrowing costs approaching 5%. 

    Higher yields offer bond investors more attractive prospective income but also create valuation pressure on equities and increase refinancing risks for heavily indebted governments and businesses.

    3. Germany’s recovery contrasts with France’s fiscal difficulties

    Germany raised its 2026 economic growth forecast from 0.5% to 1.3%, supported by exports and government investment in defence and infrastructure, while France continued to face investor concerns over its budget deficit and political uncertainty.

    The divergence highlights how fiscal spending can support near-term growth but may also undermine investor confidence when debt sustainability and fiscal credibility are in doubt.

    4. US consumer weakness raises questions over economic resilience

    Despite a relatively resilient labour market and continued economic expansion, weak consumer confidence and the cumulative impact of higher living costs have raised concerns about household purchasing power. The risk is that sustained energy inflation and high borrowing costs increasingly constrain consumption, weakening corporate earnings even if headline economic growth remains positive.

    WATCH THIS NEXT WEEK

    US Treasury yields and the September inflation report.

    The US 10-year Treasury yield ended the week around 5.24%, having retreated from above 5.3%.

    The upcoming inflation report will help determine whether higher energy prices are translating into broader price pressures and reinforcing expectations of restrictive monetary policy.

    A renewed rise in Treasury yields, accompanied by weakness in equities and widening credit spreads, would be a more significant warning than higher yields alone. Conversely, stabilising yields and improving equity market breadth would suggest that markets are absorbing the energy shock without a broader deterioration in risk appetite.

    INVESTMENT IMPLICATIONS

    The combination of persistent energy inflation, elevated borrowing costs and narrowing equity leadership argues for a more selective investment approach rather than a broad reduction in risk. Investors should prioritise companies with strong balance sheets and pricing power, while remaining cautious about highly valued growth stocks and businesses sensitive to financing costs. Within fixed income, higher yields have improved prospective returns, but intermediate-duration, high-quality bonds may offer a better balance between income and interest-rate risk than long-duration securities.

  • Market Wrap For Week Ending 2 Oct 2026

    Markets were mixed rather than decisively risk-on or risk-off. Technology, semiconductors, Japan and Korea remained strong, but Europe, China, value stocks and small caps weakened, while long-duration bonds sold off sharply and credit came under pressure.

    Equities are still holding up despite higher energy prices, rising long-term yields and signs of stress in lower-quality credit.

    TOP THEMES THIS WEEK

    1. AI investment is increasingly becoming a financing story

    Technology companies continue to raise very large amounts of debt to fund AI infrastructure, including a proposed US$60 billion financing package linked to Broadcom and Anthropic-related chip investment. At the same time, investors are demanding wider spreads and larger concessions on AI-related corporate debt than on the broader investment-grade market.

    The AI boom is no longer being funded mainly out of corporate cash flows. Rising dependence on debt increases sensitivity to interest rates, refinancing conditions and whether future AI returns justify the scale of investment.

    2. Higher yields are starting to create clearer stress outside equities

    US long-term bond prices continued to fall this week, with 20+ year Treasuries down 2.3% and almost 6% over the past month. High-yield and investment-grade corporate bonds also weakened, while spreads on the weakest CCC borrowers have reportedly widened sharply.

    This is becoming an important divergence. Equity markets — particularly technology — are still resilient, but bond and credit markets are signalling that higher borrowing costs are becoming harder to absorb.

    3. The Middle East energy shock is easing, but the economic disruption is not

    Persian Gulf oil exports have recovered substantially as producers and shipping companies find alternative routes, reducing the immediate risk of a severe global oil shortage. Brent nevertheless rose another 4% this week and remains nearly 7% higher over the past month, while container traffic and logistics through the region remain badly disrupted.

    The distinction is important: the risk of an outright energy shortage may be falling, but higher freight costs, rerouting and elevated oil prices can still keep inflation pressures alive.

    4. Economic resilience is complicating the outlook for interest rates

    US economic data remain stronger than expected, while Japan’s Tankan survey showed its strongest large-manufacturer confidence in several years. That resilience reduces near-term recession concerns but also gives central banks less reason to reverse policy tightening quickly.

    The result is uncomfortable for markets: stronger growth supports corporate earnings, but it can also keep bond yields elevated and delay the relief from lower interest rates that investors had expected.

    WATCH THIS NEXT WEEK

    US long-term Treasury yields.

    The equity market is still absorbing the rise in yields remarkably well, but the divergence is becoming harder to ignore. The S&P 500 is roughly flat over the past month and the Nasdaq remains positive, while long-duration Treasuries have fallen almost 6%.

    If yields continue climbing while energy prices remain elevated, the pressure is likely to spread more clearly into equity valuations and corporate credit. A stabilisation in yields would remove one of the largest immediate risks facing markets.

  • China Property Watch: Downturn Intact But Easing

    China’s property market is still declining, but the latest data suggest that the pace of deterioration may be slowing. The September 2026 China property market outlook shows some improvement in housing inventory and second-hand transactions, although new-home prices, sales and construction activity remain weak.

    China Home Prices Are Still Under Pressure

    Housing prices remain the clearest reason why it is too early to call a bottom.

    In August 2026, only 21 of the 70 cities tracked by China’s National Bureau of Statistics (NBS) recorded flat or rising new-home prices, down from 23 cities in July.

    First-tier new-home prices rose just 0.1% month on month. However, second-tier prices fell 0.1%, while third-tier prices declined 0.2%.

    Shanghai remained the strongest major city, with new-home prices rising 3.0% year on year. In contrast, prices in Beijing, Guangzhou and Shenzhen were still lower than a year earlier.

    Source: National Bureau of Statistics, 15 September 2026.

    Property Sales and Investment Remain Weak

    The broader activity data continue to show significant weakness.

    During January to August 2026:

    • Property sales by floor area fell 12.1% year on year.
    • Real estate development investment declined 19.9%.
    • New construction starts fell 24.8%.
    • Property completions declined 23.7%.

    Importantly, all four indicators deteriorated compared with the January-July readings.

    This suggests that developers remain cautious and that the recovery in housing demand has not yet been strong enough to restart construction activity.

    Source: National Bureau of Statistics, September 2026.

    Housing Inventory Is Starting to Improve

    The clearest positive development is housing inventory.

    Completed property available for sale fell 1.1% year on year in August, compared with a decline of 0.8% in July.

    This means housing inventory is now shrinking rather than increasing, an important step towards restoring balance between supply and demand.

    Second-hand housing activity also remains relatively resilient. Transaction area rose 10.6% year on year during January-August 2026.

    Source: NBS and Ministry of Housing and Urban-Rural Development, September 2026.

    Vanke Remains a Key Property Market Risk

    Developer stress has not disappeared.

    China Vanke has avoided a formal default, but Reuters reported on 22 September 2026 that regulators had asked banks to extend repayment terms and avoid immediately classifying some overdue Vanke loans as non-performing.

    This suggests that financial support remains necessary to prevent stress at major developers from spreading through the wider property and banking system.

    Has China’s Property Market Reached a Bottom?

    Not yet.

    There are encouraging signs: housing inventory is falling and second-hand transactions remain stronger than the new-home market.

    However, a convincing property market recovery would require broader price stability, stronger new-home sales and an improvement in construction and property investment.

    For now, the most accurate description is that China’s housing downturn is decelerating, but the market has not yet reached a clear and sustainable bottom.

    Assisted by AI

  • Market Wrap For Week Ending 25 September 2026

    Equities finished the week higher, but the gains were carried by a narrow group of tech and semiconductor names rather than the market as a whole. Small-caps and value stocks lagged. Underneath that, government bond yields pushed to multi-year highs, the dollar strengthened, and gold and the energy both sold off sharply. The mood is mixed-to-fragile: equities are still grinding higher, but the move is narrow and running against a backdrop of rising rates that has yet to hurt stocks.

    TOP THEMES THIS WEEK

    1. Bond yields spiked to their highest levels in years. The US 10-year yield jumped above 5.11% — its biggest one-day move in over a year and the highest since 2007 — while the 30-year touched 5.38–5.40%, driven by strong service-sector data, a jump in oil prices, hawkish central bank comments and weak demand at a Treasury auction. This matters because it’s the likely common driver behind this week’s dollar strength, gold weakness, and pressure on long-dated bond prices — and if it continues quickly, it’s the thing most likely to eventually catch up with equities.
    2. AI infrastructure spending is being funded with a lot of new debt, and cracks are starting to show in how markets price that risk. Total US data-centre spending is tracking toward $10.3 trillion by 2032, and SoftBank alone raised over $11 billion in junk bonds at yields near 9.875% to help fund its OpenAI commitments — even as chipmakers like Nvidia see their valuation multiples fall to decade lows. This matters because it’s a split market: fund managers such as Fidelity are actively capping tech-debt exposure below 2% on systemic-risk grounds, while others argue hyperscaler debt is still small next to total Treasury issuance — that disagreement is worth tracking, since it will decide whether tech credit becomes a genuine stress point.
    3. Middle East supply disruption pushed oil higher, but the global economy proved more resilient than feared.Intermittent closures of the Strait of Hormuz disrupted roughly a fifth of global oil and LNG trade at their peak, yet advanced economies avoided the sharp stagflationary contraction many expected, helped by lower energy intensity, inventory releases and rerouted trade. This matters for positioning because it argues against a 1970s-style shock scenario — though this week’s sharp pullback in oil and gas prices (Brent -4.96%, Dutch TTF natural gas -9.37% over the week) suggests some of that fear premium is now unwinding.
    4. Governments are competing directly for capital in AI, defence and electrification — and that’s structurally different from the last decade. Unlike the asset-light, disinflationary software boom of the 2010s, this cycle needs heavy physical investment (power generation, grids, raw materials), which keeps real interest rates structurally higher. This matters because it’s a standing argument for why bond yields may not return to the ultra-low levels investors got used to — reinforcing point 1 rather than a one-off spike.

    INVESTMENT IMPLICATIONS

    This week’s price action and the reading both point the same way: it’s a narrow, tech-led equity rally, not a broad, healthy one. Don’t assume bond yields are heading back down soon — the drivers (fiscal deficits, AI capex, industrial policy) look structural rather than temporary. On credit, the split view on tech debt is worth taking seriously; if investors want yield exposure, diversifying away from concentrated tech and hyperscaler paper and toward UK corporate credit or improving emerging-market hard-currency debt (Turkey, Mexico, Philippines) makes sense.


    Want this as a file (Word or Markdown) you can drop straight into your report, or is this fine to copy from here?